Hot Pixel Analysis--- 970527n

NOTE: DO NOT EDIT THIS FILE! It is generated dynamically by software.
Night/hemisphere dataset: 970527n

34 scans (in low density regions) identified for analysis:
s008 s009 s010 s011 s012 s013 s029 s030 s031 s032 s033 s034 s035 s036 s037 s038 s039 s040 s056 s057 s058 s059 s060 s061 s092 s093 s094 s095 s096 s097 s107 s110 s111 s112

Procedures performed are outlined in Data Processing

Results

Figure 1---
Row 1: The sum (coadd=stack) of 34 FREX (>=4) images. The plotted numbers indicate the sum of the FREX values at each pixel. Links to the FITS images are given below the K, H and J panel.
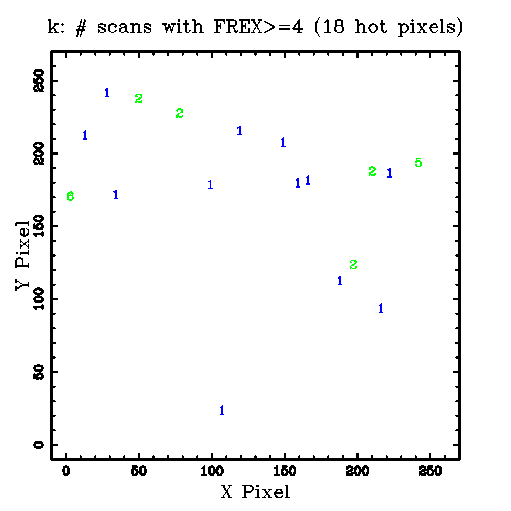
Row 2: The plotted numbers indicate the number of scans (1-34) in which FREX>=4 was found for each hot pixel.
Below the K, H and J panel are links to the corresponding tabular data.

K H J
1) Sum of FREX Images:
Tabular Data
OR mask in Fowler's Format
FITS Image

Tabular Data
OR mask in Fowler's Format
FITS Image

Tabular Data
OR mask in Fowler's Format
FITS Image
2) Scan Counts:
k.scan_cnt.tbl

h.scan_cnt.tbl

j.scan_cnt.tbl


Figure 2---
Histograms, CDFs, and comparison statistics for K-array FREX distributions.

Row 1: Data for the coadd (stack=sum) of 34 FREX (>=4) images.
Following 34 rows: Data for each scan.
Under each CDF plot is a link to the data file, and the p-level for the two-sample KS statistic. After the histogram and CFD plot are rows listing the number of points, median, mean, p-level for the Student's t test for different means, standard deviation, p-level for the F test for different variances, and a link to the original statistics program output file.

Histogram
cdf data file
CDF
cdf data file
p(KS test)
# PointsMedian
Mean
p(t)
Std
p(F)
Statistics file

k.fex.stack.hot.tbl
k.fex.stack.hot.tbl.frex-only.cdf

k.fex.stack.hot.tbl.frex-only.cdf
p(KS test)=0.000000.
Npts=18 Median=6
Mean=15.2
p(t)=1.000000
Std=25.1
p(F)=1.000000
k.fex.stack.hot.tbl.frex-only.stats

k008.fex.hot.tbl
k008.fex.hot.tbl.frex-only.cdf

k008.fex.hot.tbl.frex-only.cdf
p(KS test)=0.000000.
Npts=2 Median=13
Mean=13
p(t)=1.000000
Std=8.49
p(F)=1.000000
k008.fex.hot.tbl.frex-only.stats

k009.fex.hot.tbl
k009.fex.hot.tbl.frex-only.cdf

k009.fex.hot.tbl.frex-only.cdf
p(KS test)=
Npts= Median=
Mean=
p(t)=
Std=
p(F)=
k009.fex.hot.tbl.frex-only.stats

k010.fex.hot.tbl
k010.fex.hot.tbl.frex-only.cdf

k010.fex.hot.tbl.frex-only.cdf
p(KS test)=
Npts= Median=
Mean=
p(t)=
Std=
p(F)=
k010.fex.hot.tbl.frex-only.stats

k011.fex.hot.tbl
k011.fex.hot.tbl.frex-only.cdf

k011.fex.hot.tbl.frex-only.cdf
p(KS test)=
Npts= Median=
Mean=
p(t)=
Std=
p(F)=
k011.fex.hot.tbl.frex-only.stats

k012.fex.hot.tbl
k012.fex.hot.tbl.frex-only.cdf

k012.fex.hot.tbl.frex-only.cdf
p(KS test)=
Npts= Median=
Mean=
p(t)=
Std=
p(F)=
k012.fex.hot.tbl.frex-only.stats

k013.fex.hot.tbl
k013.fex.hot.tbl.frex-only.cdf

k013.fex.hot.tbl.frex-only.cdf
p(KS test)=0.963945.
Npts=2 Median=8
Mean=8
p(t)=0.648421
Std=1.41
p(F)=0.210274
k013.fex.hot.tbl.frex-only.stats

k029.fex.hot.tbl
k029.fex.hot.tbl.frex-only.cdf

k029.fex.hot.tbl.frex-only.cdf
p(KS test)=
Npts= Median=
Mean=
p(t)=
Std=
p(F)=
k029.fex.hot.tbl.frex-only.stats

k030.fex.hot.tbl
k030.fex.hot.tbl.frex-only.cdf

k030.fex.hot.tbl.frex-only.cdf
p(KS test)=
Npts= Median=
Mean=
p(t)=
Std=
p(F)=
k030.fex.hot.tbl.frex-only.stats

k031.fex.hot.tbl
k031.fex.hot.tbl.frex-only.cdf

k031.fex.hot.tbl.frex-only.cdf
p(KS test)=
Npts= Median=
Mean=
p(t)=
Std=
p(F)=
k031.fex.hot.tbl.frex-only.stats

k032.fex.hot.tbl
k032.fex.hot.tbl.frex-only.cdf

k032.fex.hot.tbl.frex-only.cdf
p(KS test)=
Npts= Median=
Mean=
p(t)=
Std=
p(F)=
k032.fex.hot.tbl.frex-only.stats

k033.fex.hot.tbl
k033.fex.hot.tbl.frex-only.cdf

k033.fex.hot.tbl.frex-only.cdf
p(KS test)=
Npts= Median=
Mean=
p(t)=
Std=
p(F)=
k033.fex.hot.tbl.frex-only.stats

k034.fex.hot.tbl
k034.fex.hot.tbl.frex-only.cdf

k034.fex.hot.tbl.frex-only.cdf
p(KS test)=
Npts= Median=
Mean=
p(t)=
Std=
p(F)=
k034.fex.hot.tbl.frex-only.stats

k035.fex.hot.tbl
k035.fex.hot.tbl.frex-only.cdf

k035.fex.hot.tbl.frex-only.cdf
p(KS test)=
Npts= Median=
Mean=
p(t)=
Std=
p(F)=
k035.fex.hot.tbl.frex-only.stats

k036.fex.hot.tbl
k036.fex.hot.tbl.frex-only.cdf

k036.fex.hot.tbl.frex-only.cdf
p(KS test)=0.270000.
Npts=2 Median=4.5
Mean=4.5
p(t)=0.521648
Std=0.707
p(F)=0.105859
k036.fex.hot.tbl.frex-only.stats

k037.fex.hot.tbl
k037.fex.hot.tbl.frex-only.cdf

k037.fex.hot.tbl.frex-only.cdf
p(KS test)=
Npts= Median=
Mean=
p(t)=
Std=
p(F)=
k037.fex.hot.tbl.frex-only.stats

k038.fex.hot.tbl
k038.fex.hot.tbl.frex-only.cdf

k038.fex.hot.tbl.frex-only.cdf
p(KS test)=
Npts= Median=
Mean=
p(t)=
Std=
p(F)=
k038.fex.hot.tbl.frex-only.stats

k039.fex.hot.tbl
k039.fex.hot.tbl.frex-only.cdf

k039.fex.hot.tbl.frex-only.cdf
p(KS test)=
Npts= Median=
Mean=
p(t)=
Std=
p(F)=
k039.fex.hot.tbl.frex-only.stats

k040.fex.hot.tbl
k040.fex.hot.tbl.frex-only.cdf

k040.fex.hot.tbl.frex-only.cdf
p(KS test)=
Npts= Median=
Mean=
p(t)=
Std=
p(F)=
k040.fex.hot.tbl.frex-only.stats

k056.fex.hot.tbl
k056.fex.hot.tbl.frex-only.cdf

k056.fex.hot.tbl.frex-only.cdf
p(KS test)=0.963945.
Npts=2 Median=12
Mean=12
p(t)=0.946332
Std=11.3
p(F)=0.819331
k056.fex.hot.tbl.frex-only.stats

k057.fex.hot.tbl
k057.fex.hot.tbl.frex-only.cdf

k057.fex.hot.tbl.frex-only.cdf
p(KS test)=
Npts= Median=
Mean=
p(t)=
Std=
p(F)=
k057.fex.hot.tbl.frex-only.stats

k058.fex.hot.tbl
k058.fex.hot.tbl.frex-only.cdf

k058.fex.hot.tbl.frex-only.cdf
p(KS test)=0.181300.
Npts=3 Median=4
Mean=4.33
p(t)=0.460006
Std=0.577
p(F)=0.009195
k058.fex.hot.tbl.frex-only.stats

k059.fex.hot.tbl
k059.fex.hot.tbl.frex-only.cdf

k059.fex.hot.tbl.frex-only.cdf
p(KS test)=
Npts= Median=
Mean=
p(t)=
Std=
p(F)=
k059.fex.hot.tbl.frex-only.stats

k060.fex.hot.tbl
k060.fex.hot.tbl.frex-only.cdf

k060.fex.hot.tbl.frex-only.cdf
p(KS test)=
Npts= Median=
Mean=
p(t)=
Std=
p(F)=
k060.fex.hot.tbl.frex-only.stats

k061.fex.hot.tbl
k061.fex.hot.tbl.frex-only.cdf

k061.fex.hot.tbl.frex-only.cdf
p(KS test)=
Npts= Median=
Mean=
p(t)=
Std=
p(F)=
k061.fex.hot.tbl.frex-only.stats

k092.fex.hot.tbl
k092.fex.hot.tbl.frex-only.cdf

k092.fex.hot.tbl.frex-only.cdf
p(KS test)=
Npts= Median=
Mean=
p(t)=
Std=
p(F)=
k092.fex.hot.tbl.frex-only.stats

k093.fex.hot.tbl
k093.fex.hot.tbl.frex-only.cdf

k093.fex.hot.tbl.frex-only.cdf
p(KS test)=
Npts= Median=
Mean=
p(t)=
Std=
p(F)=
k093.fex.hot.tbl.frex-only.stats

k094.fex.hot.tbl
k094.fex.hot.tbl.frex-only.cdf

k094.fex.hot.tbl.frex-only.cdf
p(KS test)=0.963945.
Npts=2 Median=12
Mean=12
p(t)=0.941839
Std=9.9
p(F)=0.902251
k094.fex.hot.tbl.frex-only.stats

k095.fex.hot.tbl
k095.fex.hot.tbl.frex-only.cdf

k095.fex.hot.tbl.frex-only.cdf
p(KS test)=0.270000.
Npts=2 Median=4.5
Mean=4.5
p(t)=0.521648
Std=0.707
p(F)=0.105859
k095.fex.hot.tbl.frex-only.stats

k096.fex.hot.tbl
k096.fex.hot.tbl.frex-only.cdf

k096.fex.hot.tbl.frex-only.cdf
p(KS test)=
Npts= Median=
Mean=
p(t)=
Std=
p(F)=
k096.fex.hot.tbl.frex-only.stats

k097.fex.hot.tbl
k097.fex.hot.tbl.frex-only.cdf

k097.fex.hot.tbl.frex-only.cdf
p(KS test)=0.270000.
Npts=2 Median=4.5
Mean=4.5
p(t)=0.521648
Std=0.707
p(F)=0.105859
k097.fex.hot.tbl.frex-only.stats

k107.fex.hot.tbl
k107.fex.hot.tbl.frex-only.cdf

k107.fex.hot.tbl.frex-only.cdf
p(KS test)=
Npts= Median=
Mean=
p(t)=
Std=
p(F)=
k107.fex.hot.tbl.frex-only.stats

k110.fex.hot.tbl
k110.fex.hot.tbl.frex-only.cdf

k110.fex.hot.tbl.frex-only.cdf
p(KS test)=0.270000.
Npts=2 Median=4
Mean=4
p(t)=0.507902
Std=0
p(F)=0.000000
k110.fex.hot.tbl.frex-only.stats

k111.fex.hot.tbl
k111.fex.hot.tbl.frex-only.cdf

k111.fex.hot.tbl.frex-only.cdf
p(KS test)=
Npts= Median=
Mean=
p(t)=
Std=
p(F)=
k111.fex.hot.tbl.frex-only.stats

k112.fex.hot.tbl
k112.fex.hot.tbl.frex-only.cdf

k112.fex.hot.tbl.frex-only.cdf
p(KS test)=
Npts= Median=
Mean=
p(t)=
Std=
p(F)=
k112.fex.hot.tbl.frex-only.stats


Last update: 26-Aug-97 (10:38:34), Joe Mazzarella (mazz@ipac.caltech.edu )