A table that lists the scan counts and their (X,Y) coordinates is here.
1) K-array: The K array mask for the 3 pixels which occur in all 22 scans is referred to here as the "AND mask". Although this is not a complete list of problem pixels, these are the only pixels which are consistently hot across examined scans for this night. The hot pixel AND mask (used to construct a corresponding image mask) for the K array in the format prescribed by John Fowler (band_code, x, y) is:
3  87 242
3 177 209
3 186 194
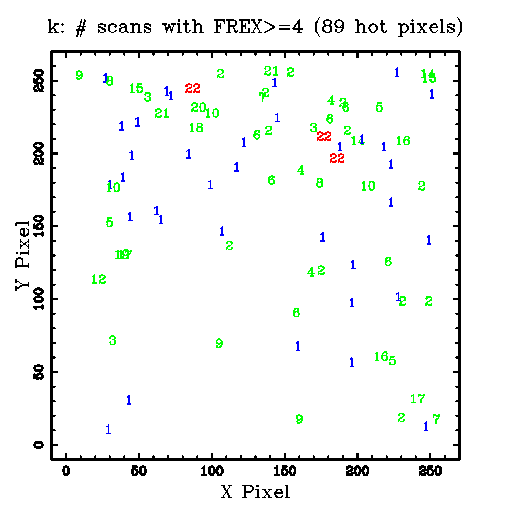
Examination of the data in Figure 1 of 970418n or Figure 1 of 970423n shows many intermittent hot pixel candidates (FEX >= 4) in addition to the few pixels discussed above which are present in all K scans. They range from pixels which appear hot in the majority of scans, to a few pixels which are very "hot" (>10 frame extractions) in only 1 or 2 scans, but lack even a moderate number of extractions in the remaining majority of scans.
There is a total of 89 pixels in the K array in which more than 3 frame extractions (FEX >= 4) occur in at least one scan. This complete list of mostly intermittent hot pixels is referred to here as the "OR mask". Figure 1 is a plot of the K array OR mask, where the numbers plotted indicate the number of scans in which FREX>=4 was found in each pixel. This is taken from Figure 1 of 970418n
Figure 1--- K Array "OR mask for 970418n"
A table that lists the scan counts and their (X,Y) coordinates is
here.
2) H-array: No pixel is hot in all 22 scans. However,
there is 1 hot pixel persistent in the
majority (20 out of 22) scans: (8,117).
The number of H<14 mag extractions at pixel (8,117) sums to 203 for
22 scans examined in 970418n. Two other candidate pixels with FREX>4
appear in only 1 out of 22 scans. Therefore, the
The H-array AND mask (for 20 of 22 scans) is:
2 8 117
and the H-array OR mask is:
2   8 117
2 149 223
2 231  75
3) J-array: There is 1 hot pixel in the J array. Although it appears in only 2 out of 22 scans for 970418n, it has a very high summed FREX of 80. There is no AND mask, and the J-array OR mask is:
1 232 100
4) K Scan FREX Distributions
Figure 2 of 970418n.html displays histograms and CDS, first for the coadded FREX image, and then for the individual K scans. A comparison of the mean, variance, and CD for each scan FREX distribution compared to the first scan examined for the night was performed using the Student's t, F-test, and K-S statistics, respectively. These statistics are presented in the columns of Figure 2.
Highlights include:
1. The number of hot pixels (FREX>=4) in any single scan ranges 18-28.
2. Since the two-sample K-S statistic is a non-parametric statistic that does not assume anything about the underlying population distribution function (e.g., Gaussian), it is the most robust and unbiased test as to whether the distributions of hot pixels are significantly different from the distribution of FREX for the selected reference scan. Thus, overall the histogram/CDF of hot pixels (number of frame extractions) seems to be similar for all 22 scans examined this night.
3. The Student's t test shows that we cannot reject the null hypothesis that the scan FREX means are significantly different from the reference scan at a significance level better than even p=0.10. The reference scan mean is 12 and the median is 20.
4. We see that other than a significantly higher variance for scan k023 (1.33e+03), and a lower variance (144) for scan k029, compared to the variance for reference scan k001 (387), we cannot reject the null hypothesis that the scan FREX variances are significantly different from the reference scan at a significance level better than p=0.05.
5. Using reference scan k001 as the typical FREX CDF for this night, we can summarize the percentiles of the CDF as follows: