A table that lists the scan counts and their (X,Y) coordinates is here.
As the night 970423n plots and statistics show, the results for 21 scans examined for this night are very different from night 970418n.
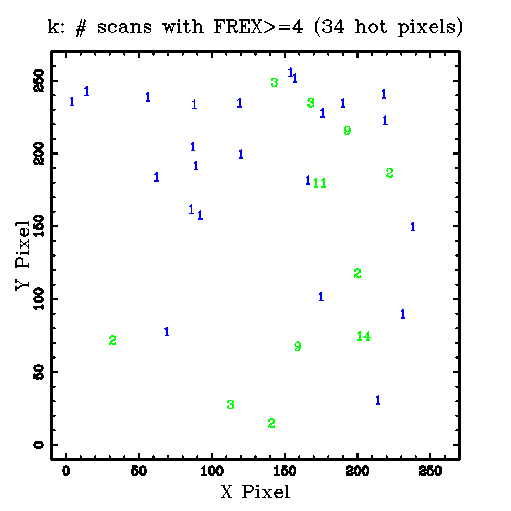
1) K-array: There are no hot pixels persistent in all 21 examined scans. The maximum number of scans in which the same hot pixel occurs is 14, at pixel (204, 72). Thus there is no AND mask for this night.
There are only 34 pixels in the K array in which more than 3 frame extractions (FREX >= 4) occur in at least one scan. Figure 1 is a plot of the K array OR mask, where the numbers plotted indicate the number of scans in which FREX>=4 was found in each pixel. This is taken from Figure 1 of 970423n
Figure 2--- K Array "OR mask for 970423"
A table that lists the scan counts and their (X,Y) coordinates is
here.
2) H-array: No pixel is hot in all 21 scans. Also, there is only 1 scan in which 1 mildly hot pixel (FREX=4) occurs. Therefore, unlike for night 970418n, there is no H-array AND mask, and the H-array OR mask (if one is justifiable at all) is simply:
2 118 45
3) J-array: This is completely clean. There are no pixels with FREX>=4 in any scan of the 21 scans processed for this night.
4) K Scan FREX Distributions
The histograms, CDFs and distribution comparison statistics for the 21 examined scans are in Figure 2 of 970423n.html. The number of hot pixels (FREX>=4) in any single scan ranges only 3-6, compared to 18-28 for 970418n. With so few hot pixels in any single scan, comparison of the distributions suffers from low-number statistics. However, the following conclusions can be stated confidently:
1. The FREX histograms for all the scans are bimodal. Generally there are 1-3 pixels with FREX<=8, and 1-2 pixels with FREX>~ 15.
2. As for night 970418n, the 2-sample KS test statistics give no reason to reject the null hypothesis that all the K scans have the same overall distribution of hot pixels. However, the 970423n K-array FREX distribution is obviously very different from that night 970418n; it has far fewer hot pixels, and pixels that are hot occur at much lower FREX levels than in night 970418n.
3. The Student's t test shows that we cannot reject the null hypothesis that the scan FREX means are significantly different from the reference scan at a significance level better than even p=0.10. The reference scan mean FREX is 5 and the median FREX is 11.
4. The only cases with formal F-test results that indicate different variances in their FREX distributions are two scans with only 3-4 hot pixels. These low-number statistics are not significant enough to reject the hypothesis that the FREX variances are the same.
Additional details can be found in report for 970418n.
2. The results so far, for 2 nights, suggest that we cannot construct a global pixel mask to reliably mask hot pixels that are found on different nights. Instead, an OR mask could be constructed for each night's data.
3. One naturally asks whether a single OR mask should be constructed to mask all K-array pixels that appear hot in any scan from any night. There are only 8 pixels in common between the OR masks of nights 970418n and 970423n:
3  32  69
3  56 236
3 143 246
3 154 253
3 159  65
3 174 177
3 190 232
3 193 213
Thus, the joined K-array OR mask for nights 970418n and 970423n has a total of 89+34-8=115 pixels, with only the above 8 pixels in common.
4. While the joined OR mask can be used initially to (blindly) mask all hot pixels for nights 970418n and 970423n, further work may be warranted to go beyond characterizing the frequencies of hot pixels. One might like to understanding their cause, or more importantly, why they change so drastically from night to night, yet remain fairly consistent in their distributions within a night. Are there night-to-night (and scan-to-scan) differences in the array operating temperatures, readout electronics, or other parameters which influence the hot pixel counts? If so, an optimal combination of parameters might be identified to minimize them (e.g., keep them closer to the counts of night 970423n rather than night 970418n).
5. Given the high degree of redundancy produced by dithering and frame overlap, perhaps the intermittent hot pixels should be treated like cosmic rays and just masked on a scan-by-scan basis. Alternatively, there are so few hot pixels, and they are distributed randomly enough across the array, even in the joined OR mask (115) for the first 2 nights of processed data, that perhaps we should just utilize the joined OR mask and move on to more interesting problems! However, now that the measurements needed to characterize and compare the frequencies and distributions of hot pixels in a bulk fashion are automated, examination of additional scans from more nights may help determine how to minimize the occurance of hot pixels or treat them in software most intelligently. Suggestions are welcome from the 2MASS team regarding whether additional analysis of hot pixels is warrented.