


|
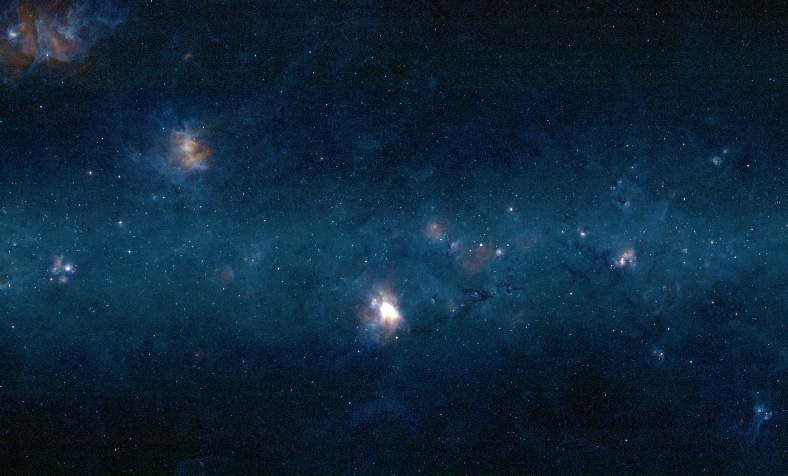
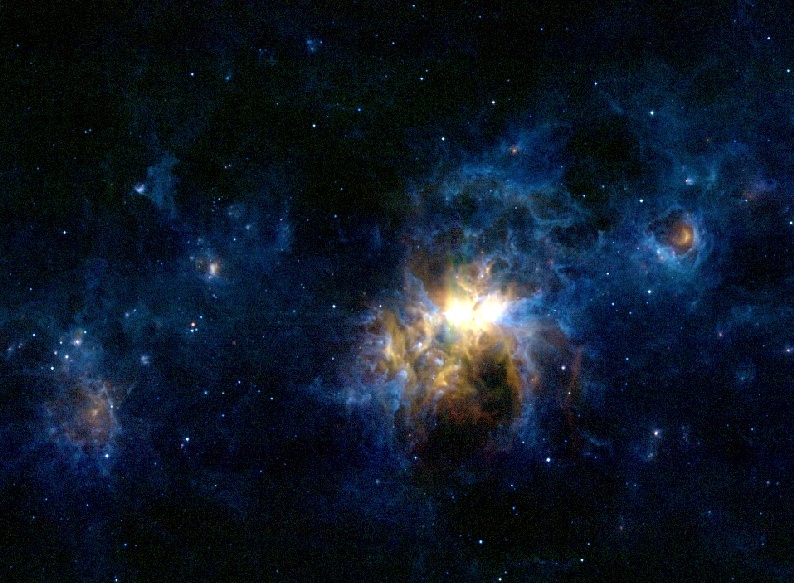
A three color image of a region of the Galactic Plane 7.5° by 4.5° in size centered on l = 16.0°, b = 0.0°. In the image, the Omega Nebula (M17) and Eagle Nebula (M16) are clearly visible (Image links: 788x476, 1517x917). |
|
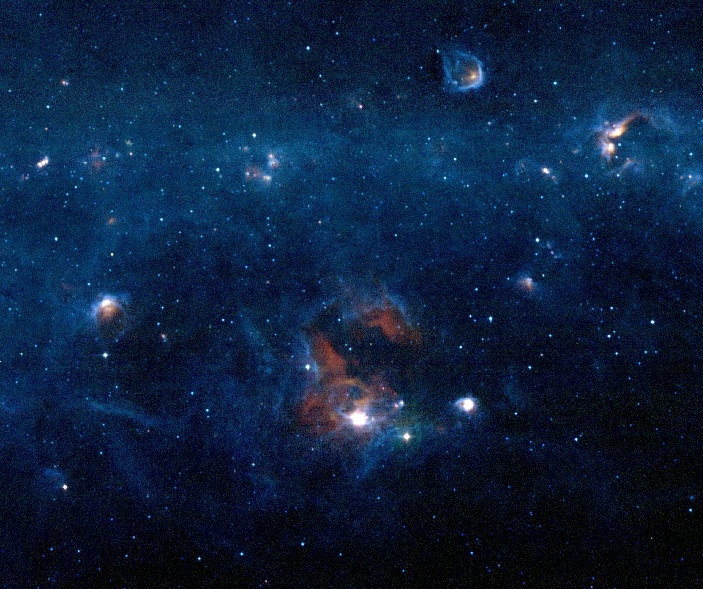
A three color image of a region of the Galactic Plane 3.0° by 2.5° in size centered on l = 348.0°, b = -0.5°. Visible are several shells and filaments in particular the shells of red emission just below the center of the image. (Image links: 703x589, 1851x1551). |
|
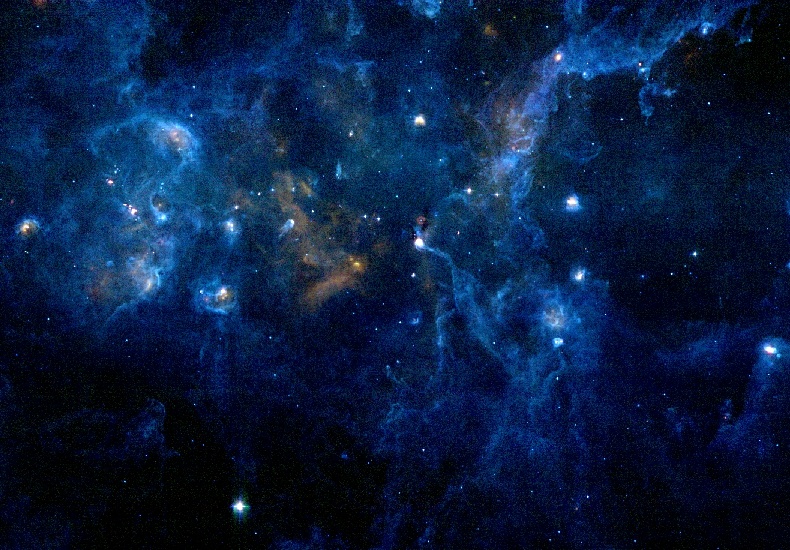
A three color image of a region of the Galactic Plane in Cygnus. The image is 6.5° by 4.5° in size. Visible are many filaments associated with the star forming regions in Cygnus. (Image links: 790x550, 1317x917). | |
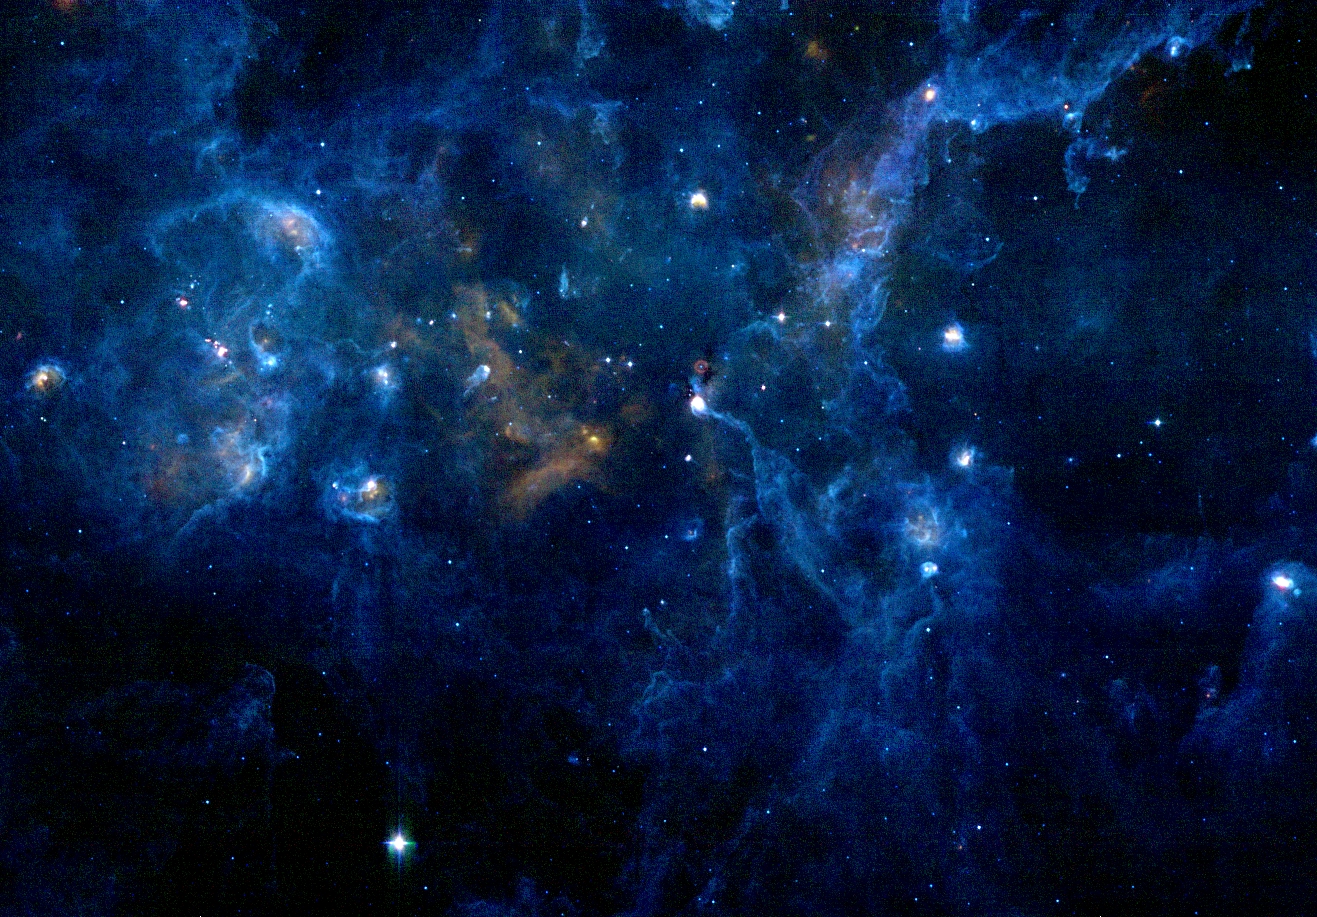
An 8 micron image of a region of the Galactic Plane in Cygnus. The image is 14.0° by 10.0° in size. (Image links: 799x580, 1378x1000). | |
A three color image of the Carina Nebula. The hypermassive star Eta Carina is in the bipolar bright emission nebula just right of image center. (Image links: 794x583, 957x703). | |
An 8 micron image of the Carina Nebula. (Image link: 617x617). | |
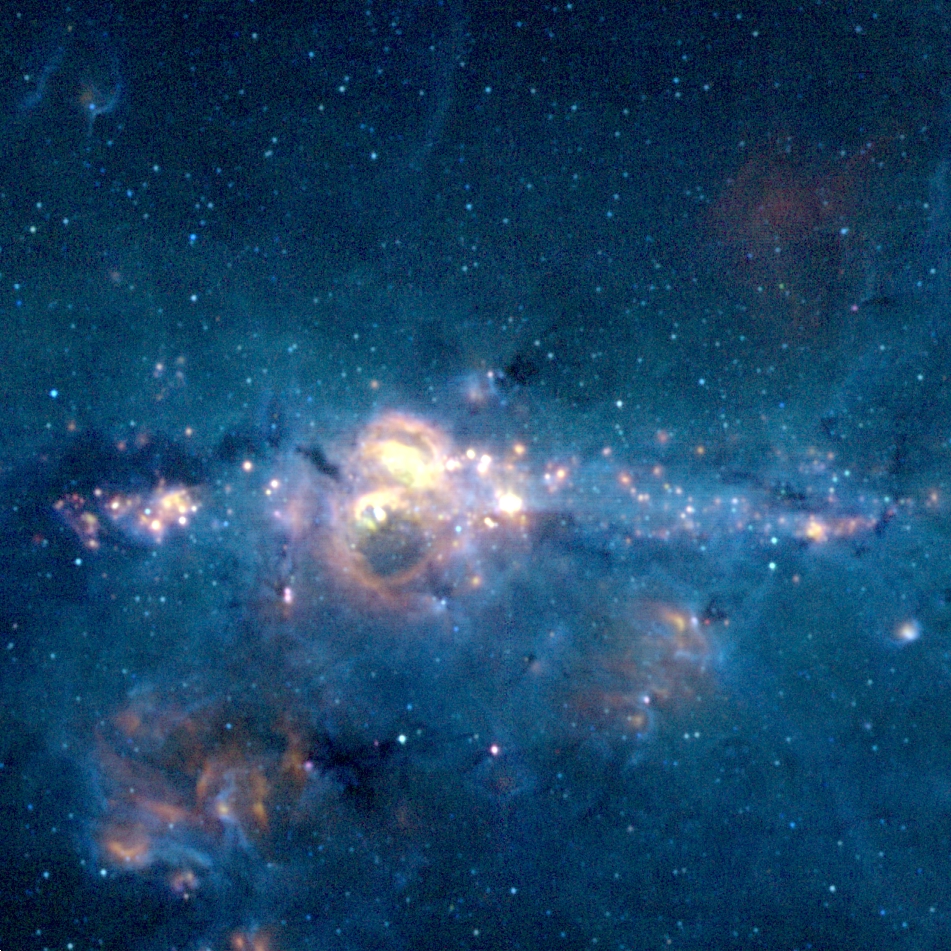
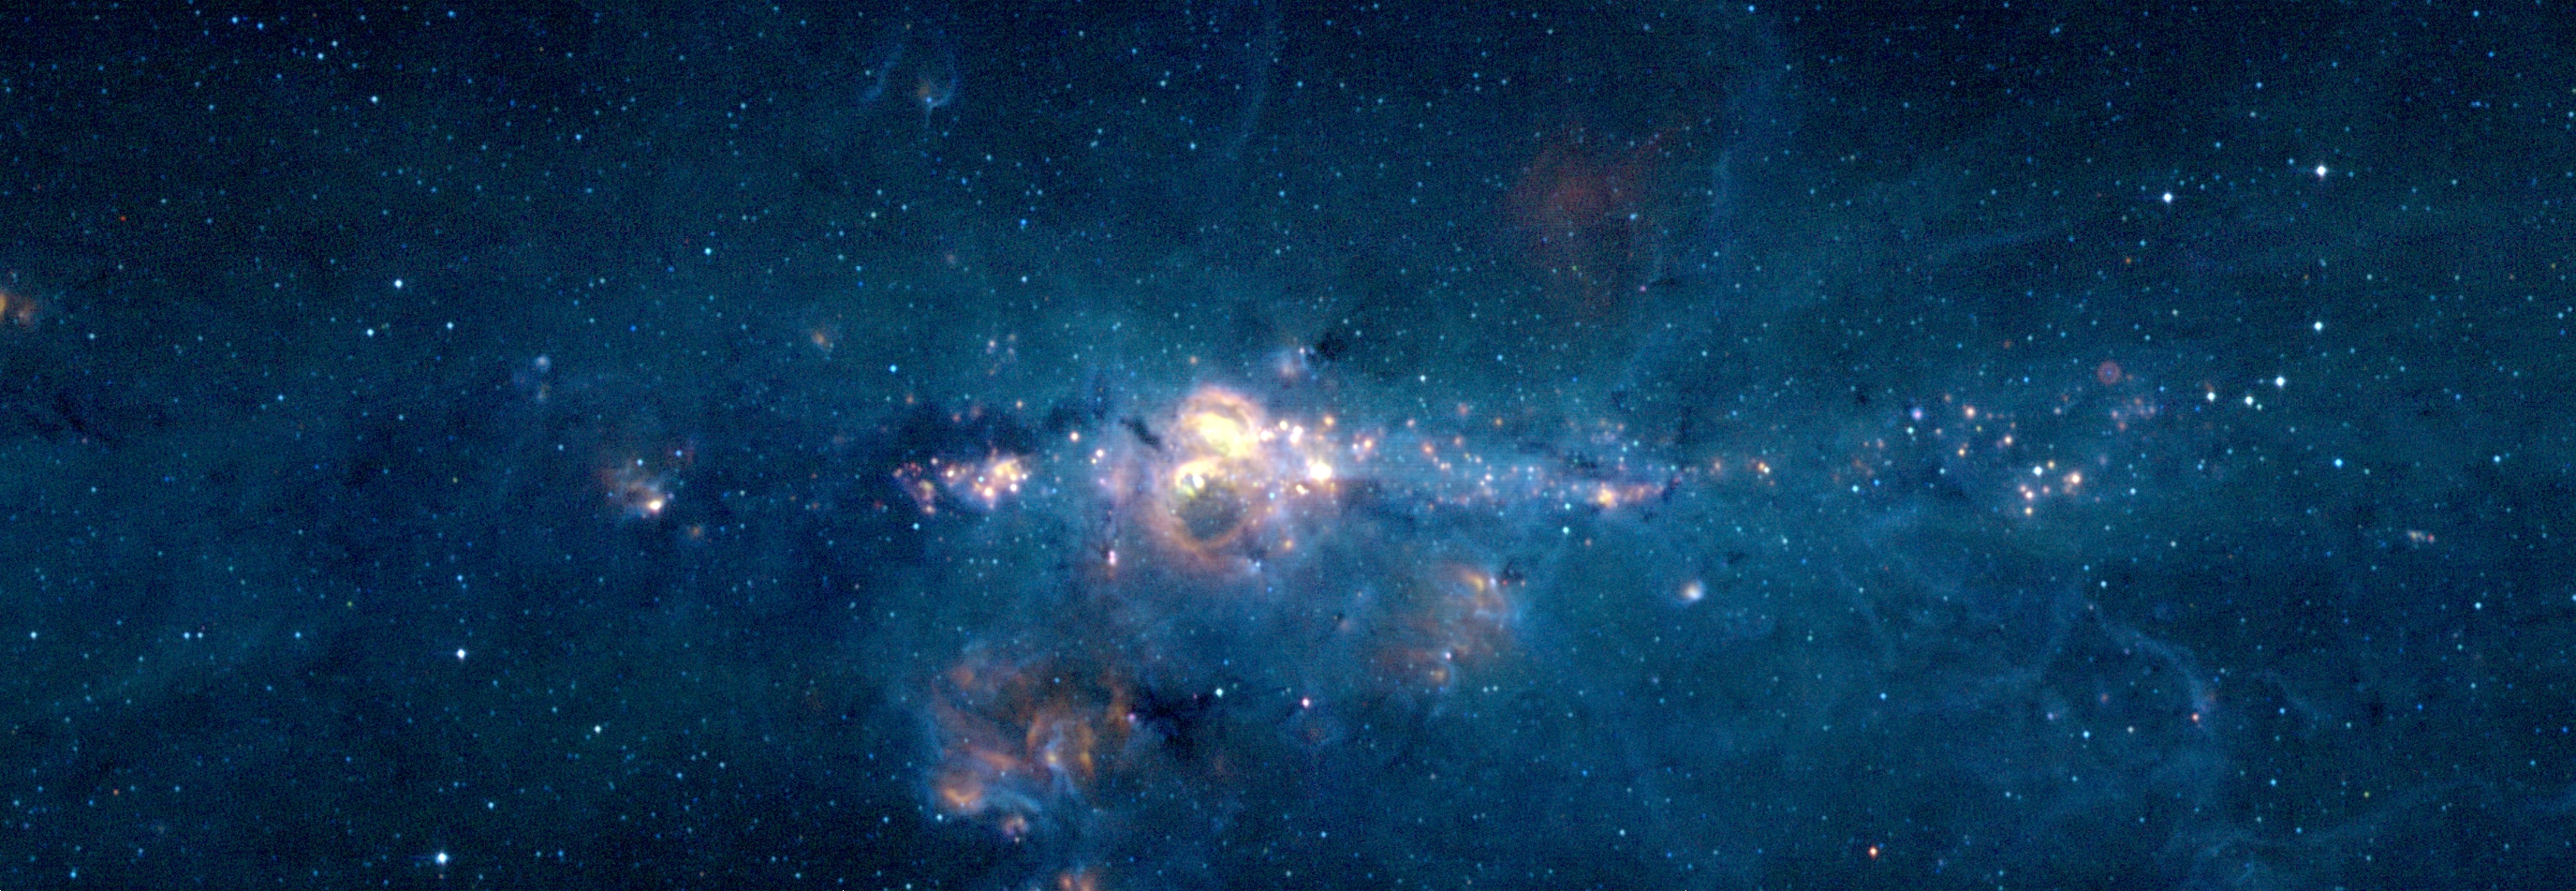
A three color image of the MSX Galactic Plane Survey plate of the Galactic Center. The image is 1.5° by 1.5°. (Image links: 599x599, 951x951). | |
A three color image of a 4.5° by 1.5° field centered on the Galactic Center. (Image link: 2751x951) | |
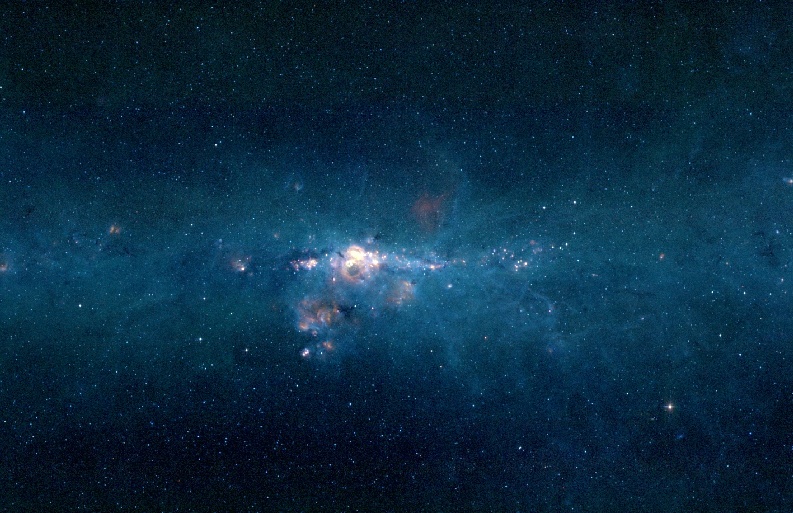
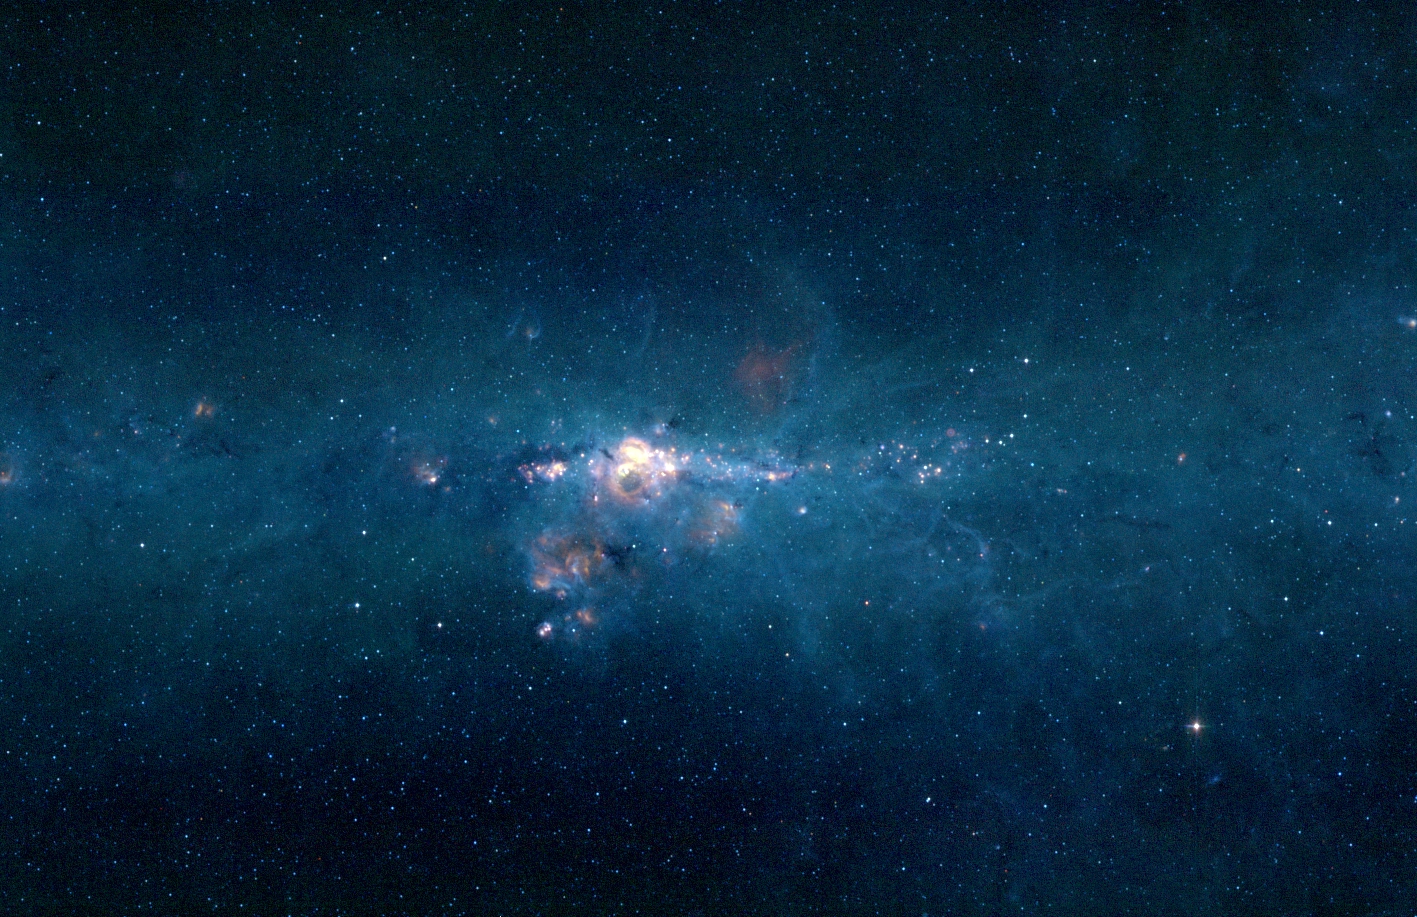
A three color image of a 6.1° by 4.0° field centered on the Galactic Center. Note that the bulk of the mid-infrared emission is within one degree of the plane. (Image links: 793x513, 1417x917) | |
An 8 micron image of a 12.0° by 10.0° field centered on the Galactic Center. (Image links: 720x600, 1200x1000) | |
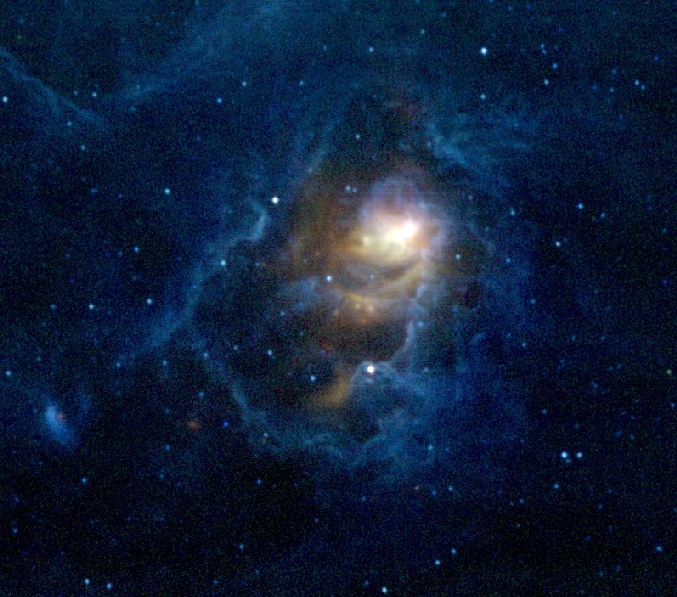
A three color image of the Lagoon Nebula. The image is approximately one square degree in size. (Image link: 677x597) | |
An 8 micron image of the Rosette Nebula. (Image link: 800x672, 1814x1524) |
|
An image of the Galactic Center at 7 microns from the Infrared Space Observatory (ISO). (Image link: 947x439, 2366x1096) |
|
An MSX 8 micron image overplotted with 13CO contours from the BU/FCRAO Galactic Ring Survey. (Image link: 1288x729, 2575x1458) |
Each image displays the intensity of emission as seen in MSX Band A which is sensitive to emission between 6 and 11 microns. The brightness of emission increases as the image color changes from black to red to white.
Each image is a composite of three colors (red, green, blue) as seen by the SPIRIT III infrared telescope aboard the Midcourse Space Experiment (MSX). Blue in this picture is emission from MSX Band A, which is sensitive to emission between 6 and 11 microns. Green color is due to the composite of MSX Bands C and D covering the wavelength range between 11 and 16 microns. MSX Band E data, which spans wavelengths between 18 and 25 microns, is represented by red. The brightness of each color is directly proportional to the intensity of the infrared light observed in each band.
The emission in each image is due to point sources that are primarily infrared bright stars and more diffuse emission from interstellar dust which has absorbed visible and ultraviolet starlight. The dust then re-radiates the absorbed starlight at infrared wavelengths.
Regions which appear white in the images have fairly equal amounts of emission in Band A, Bands C+D and Band E.
Blue regions are dominated by emission in Band A. The emission is primarily from large molecules or very small dust grains (a few nanometers in size) composed of hydrocarbons. Small hydrocarbon grains emit in spectral bands at 6.6, 7.7 and 8.6 microns due to stretch modes of C-C bonds. This dust is similar in size and composition to auto exhaust and is believed to be polycyclic aromatic hydrocarbons, a class of organic molecule composed of benzene rings.
The red regions are areas which are brightest in band E. The diffuse emission in Band E is primarily due to small dust grains (tens of nanometers in size; larger than the PAHs producing emission in Band A). The small grains have been heated to temperatures of several hundred Kelvin by nearby hot, young stars and shocks propagating through the interstellar medium.