
| A Search for Galaxies in the Zone of Avoidance using WISE | |
Our goal is simple: mine the WISE-field Infrared Survey Explorer (WISE) image archive for galaxy candidates in the zone of avoidance (ZOA) using specially adapted high-resolution image processing and color/morphological selection criteria, then follow these up using HI radio observations. The WISE all-sky survey, with sensitivies of up to 500-1000x those achieved by IRAS, offers a unique opportunity to extend our knowledge of local large scale structure.
As a first test, we coadded single-exposure image products from the WISE Preliminary Release that contained the two galaxies discovered by Jarrett et al. (2007) in the Great Attractor Wall. We experimented with three co-addition methods:
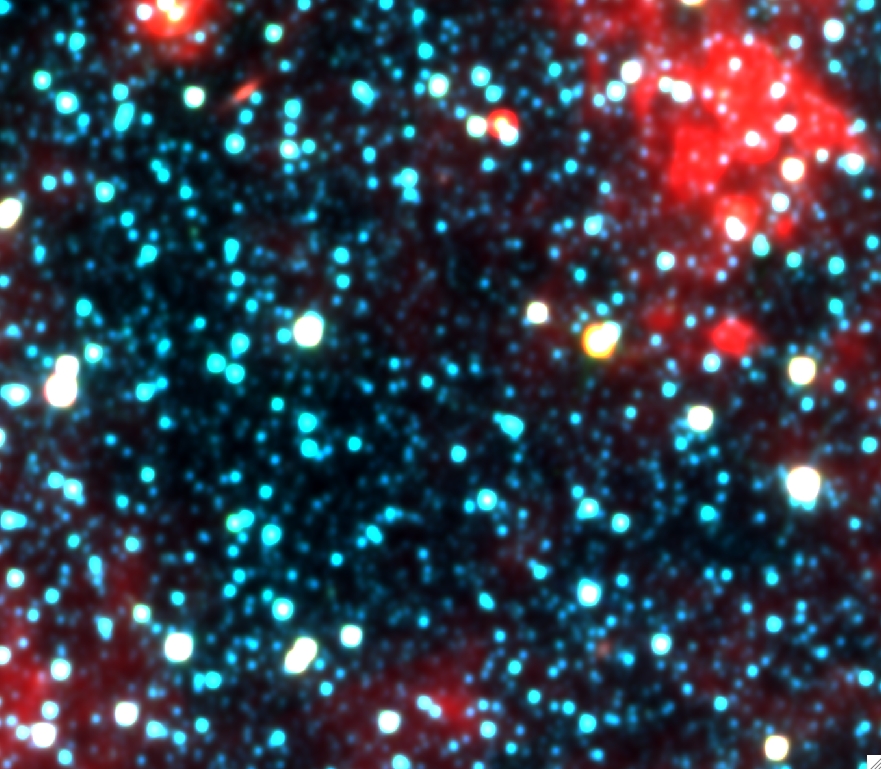
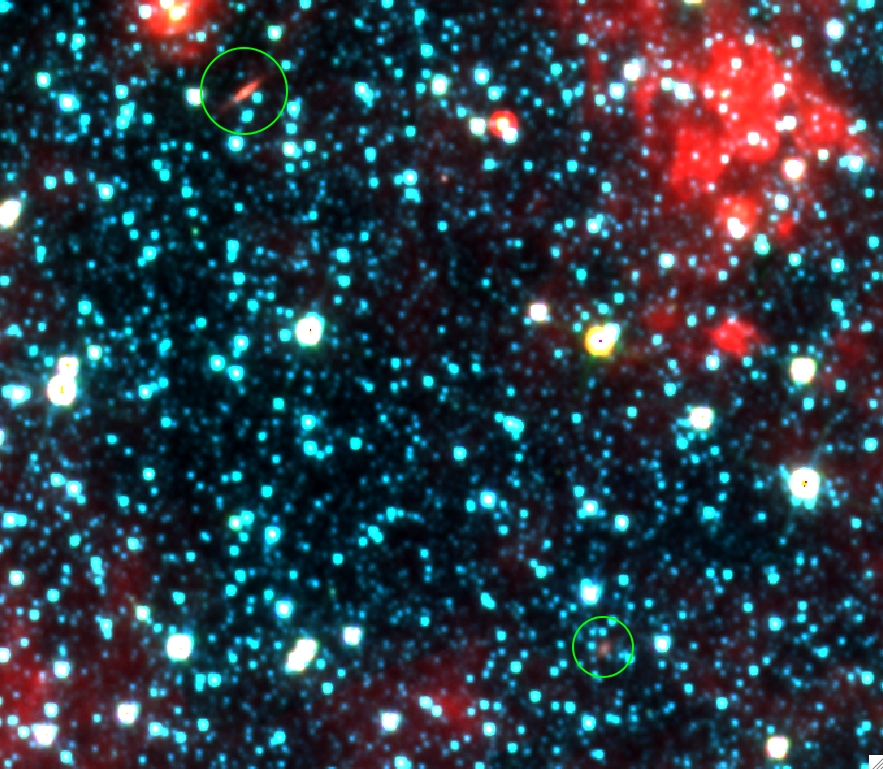
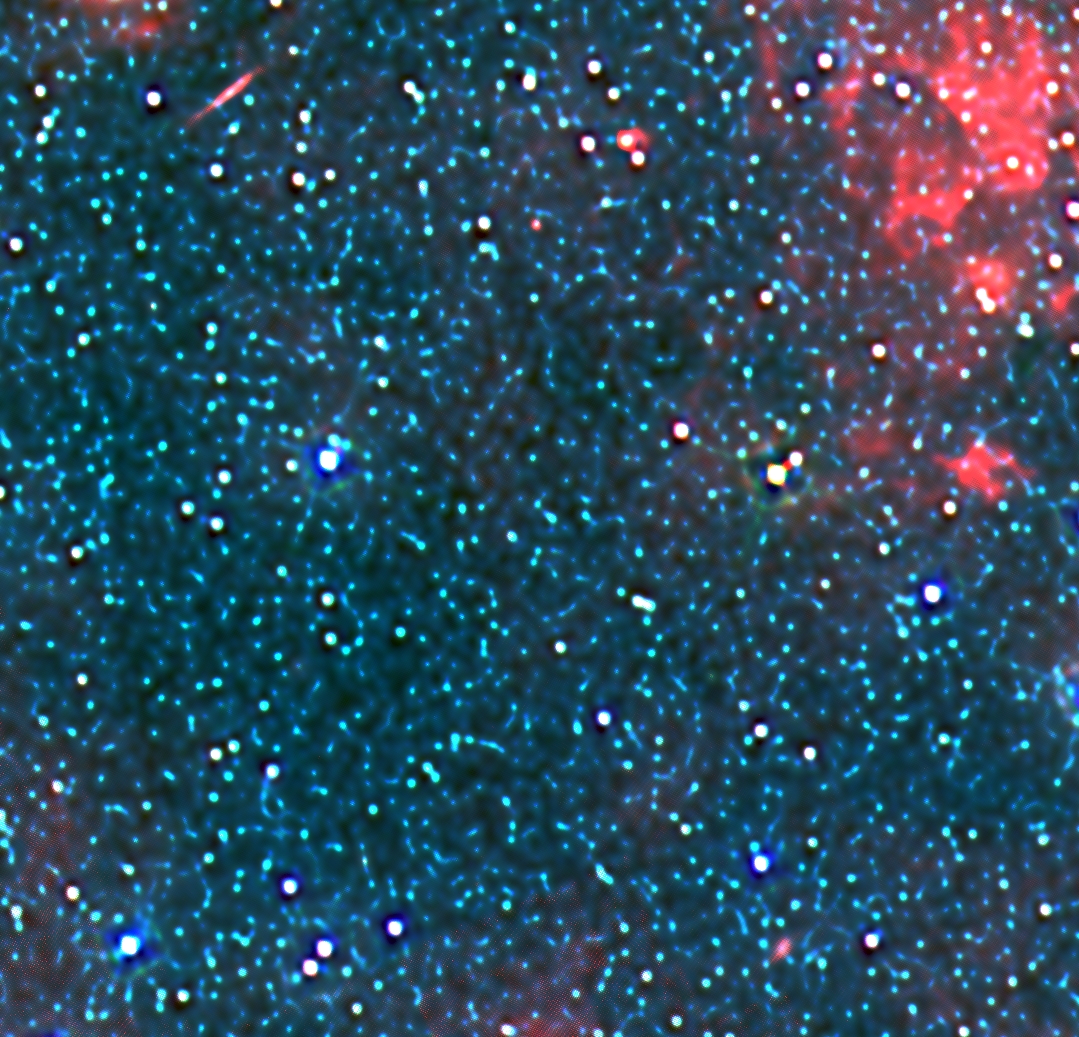
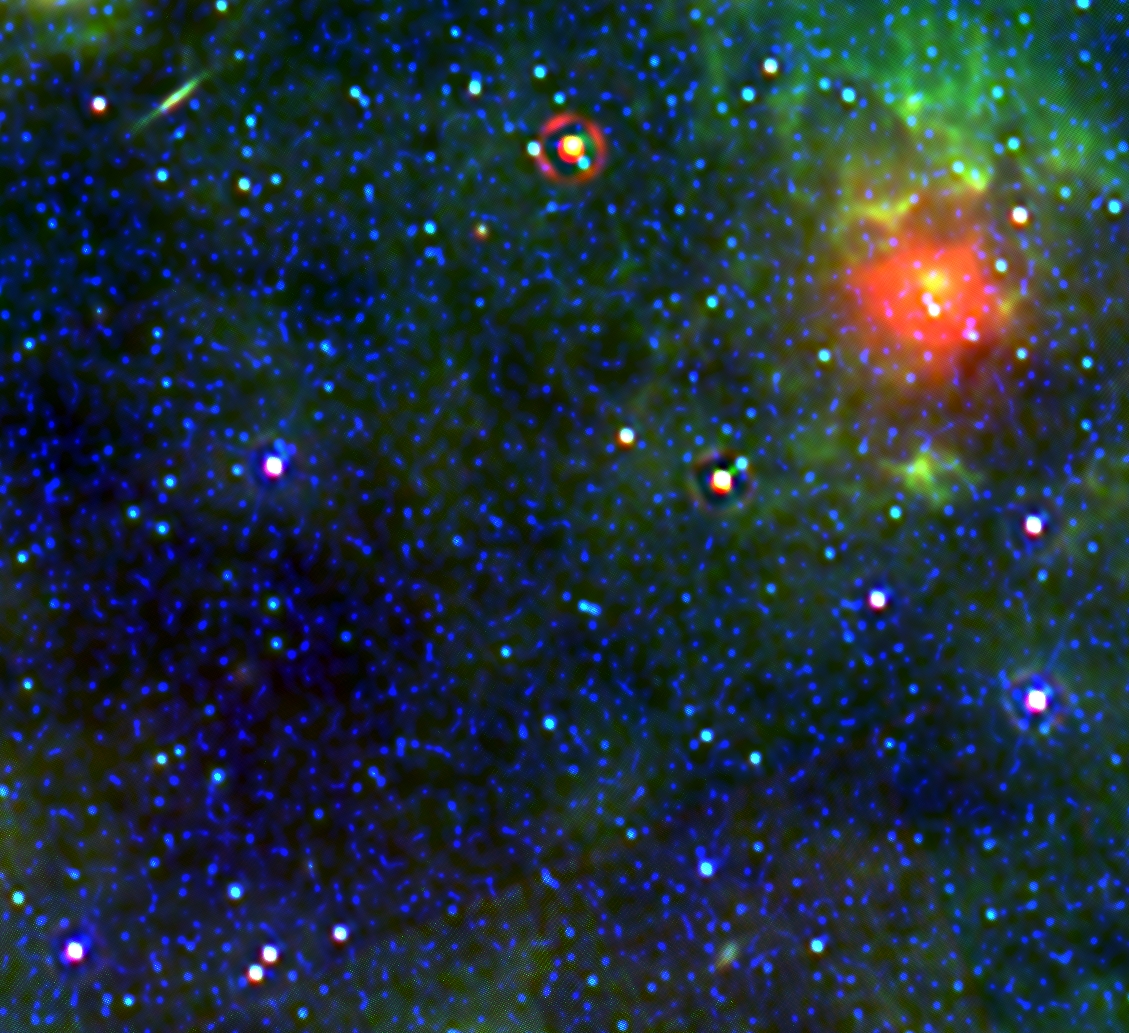
The highly obscured galaxies "G1" and "G2" are circled green in Figures 2, 3 & 4. They are actually visible in all coadds even though they are not circled in some.
The spatial resolution of the publically released Image Atlas (from method i) is not optimal for this study since the image data were specifically optimized for detecting point sources when generating the WISE Source Catalog. A drawback of the MCM-HiRes method (iii) is its long runtime for large fields. It is well suited for small fields with an extent of a few arcminutes. The drizzle method (ii - Figures 3 & 4) is a good compromise for co-adding large swaths of sky reasonably fast and with good enough resolution for selecting initial galaxy candidates via their fuzz-like (or non PSF-like) morphology. The initial selection process will also use colors involving the W1, W2, and W3 bands, i.e., our most sensitive and "sharpest" bands. The candidates will then be examined using high-resolution image processing to further weed out contaminants. Cross correlation with existing radio catalogs (e.g., NVSS) may also be attempted to secure candidates. These will then be ready for HI follow-up, assuming of course they weren't observed in previous HI surveys.
We will start with a pilot study to validate the efficiency and reliability of our galaxy identification algorithms. A good starting point will be regions in the ZOA known a priori to contain a high density of obscured galaxies as discovered by previous HI and/or Spitzer surveys (e.g., ALFA-ZOA, HIPASS, GLIMPSE & MIPSGAL). A characterization of all previous HI-discovered galaxies in the IR, as the WISE sensitivity limits allow, will also be interesting in its own right. This will allow a better census of the local star-formation efficiency, stellar and gas mass, and their relationship to environment in the local cosmic web. Our primary goal however is to search for new galaxies in the entire ZOA.
I (Frank Masci) am very new to this field, in particular on what has been done before. Ideas are very welcome!
 |
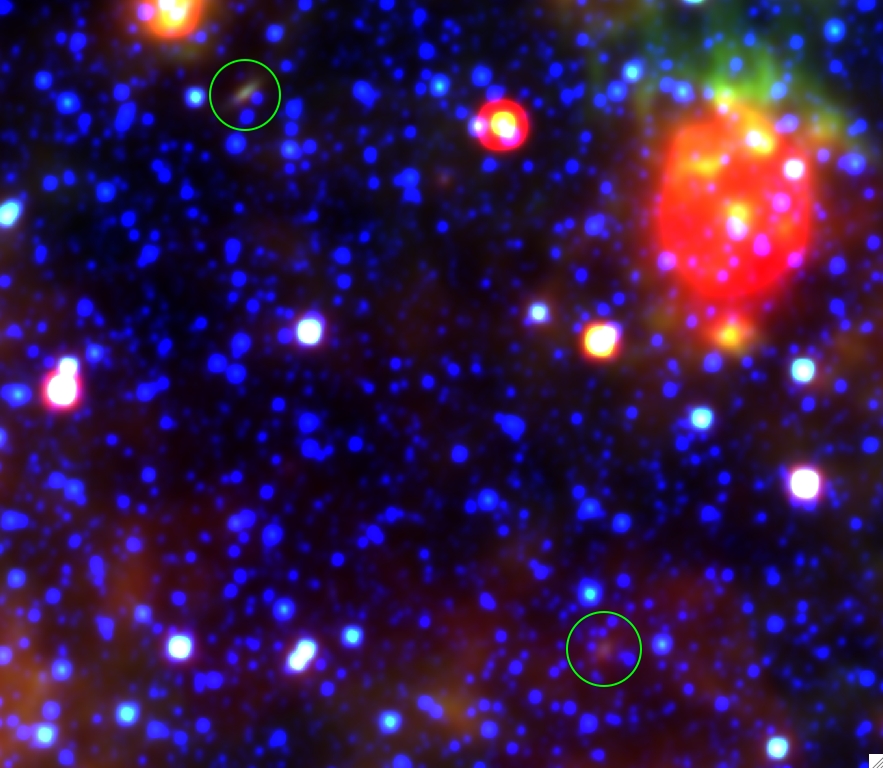 |
| Figure 1 - Nominal Atlas Image color-composite coadd: Blue, Green, Red = W1(3.4μm), W2(4.6μm), W3(12μm). Click to enlarge. | Figure 2 - Nominal Atlas Image color-composite coadd: Blue, Green, Red = W1(3.4μm), W3(12μm), W4(22μm). Click to enlarge. |
 |
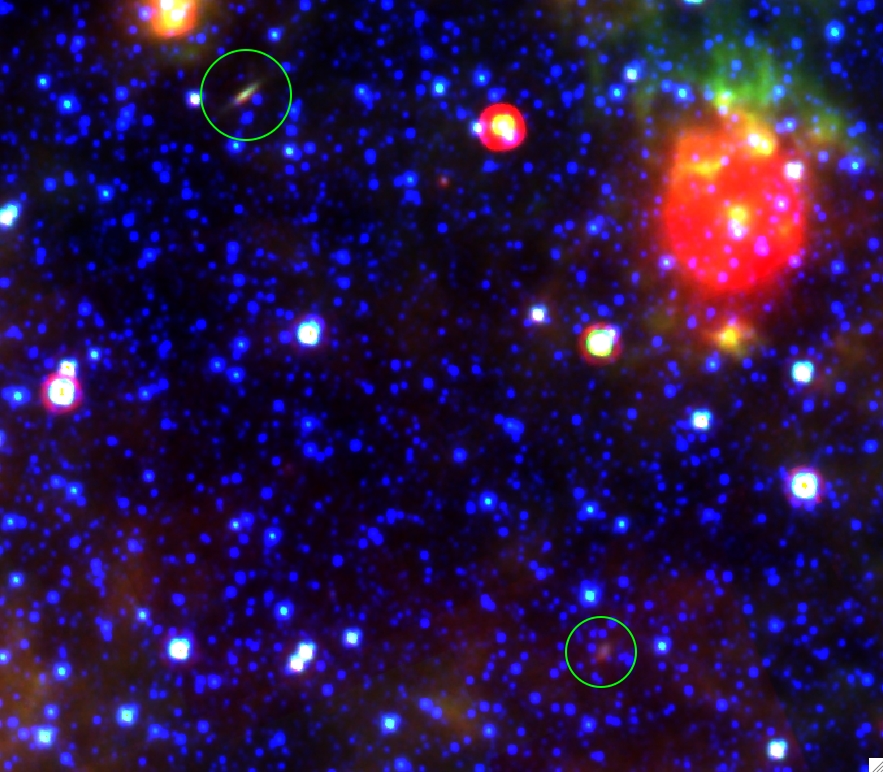 |
| Figure 3 - Color-composite coadd using drizzled area-weighted interpolation: Blue, Green, Red = W1(3.4μm), W2(4.6μm), W3(12μm). Click to enlarge. | Figure 4 - Color-composite coadd using drizzled area-weighted interpolation: Blue, Green, Red = W1(3.4μm), W3(12μm), W4(22μm). Click to enlarge. |
 |
 |
| Figure 5 - Resolution enhanced color-composite using the MCM-HiRes algorithm: Blue, Green, Red = W1(3.4μm), W2(4.6μm), W3(12μm). click to enlarge. | Figure 6 - Resolution enhanced color-composite using the MCM-HiRes algorithm: Blue, Green, Red = W1(3.4μm), W3(12μm), W4(22μm). Click to enlarge. |