 |
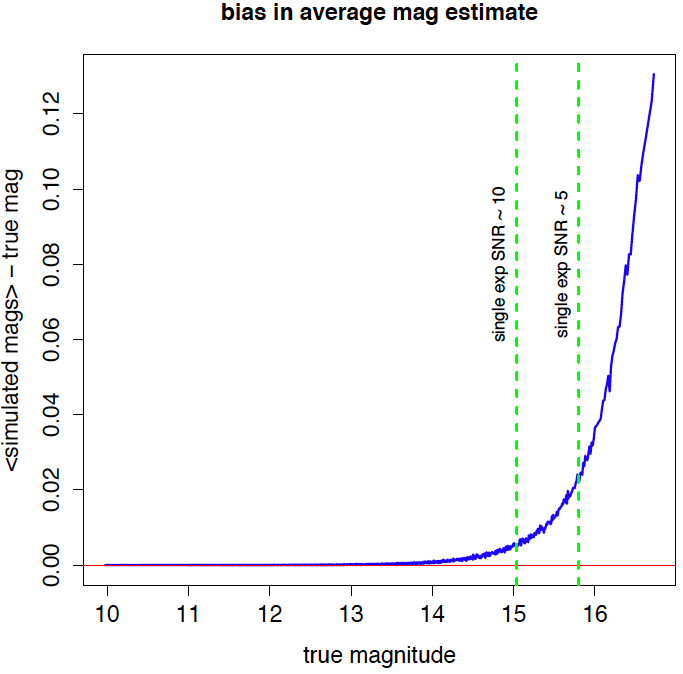
| Figure 1 - Bias introduced from averaging a sample of repeated magnitude measurements directly as a function of true magnitude where 'fluxes' (counts) were drawn from a Gaussian noise population with mean=true DN, sigma=18.751 DN (see text). |
F. Masci, 20 March 2012
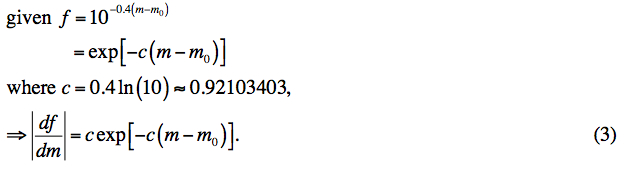
It is common practice in astronomy to convert fluxes into magnitudes via the log transformation: m = m0 - 2.5*log10(flux), where m0 is the instrumental zero point. Little is it realized that this transformation changes the shape of the resulting distribution relative to that of the input flux measurements. For example, if one has repeated flux measurements that are affected by Gaussian noise, then this transformation will make the noise distribution (in magnitude space) non-Gaussian. The shape of the distribution will be skewed towards fainter magnitudes and the asymmetry will be greatest when the signal-to-noise (S/N) ratio is low [see below]. Therefore, if one attempts to average (or compute other moments) from repeated measurements that have been "logged", a bias will result. This bias can be computed analytically and hence corrected. However, it can be avoided entirely if the statistics of interest are first computed in native flux space (e.g., an average flux), and then converted into magnitudes. This is one of the banes of the astronomical magnitude system!
We have simulated the bias by constructing repeated (noisy)
flux measurements (in DN) affected by Gaussian noise and then
computing their average and standard-deviation after
converting them into magnitudes. We adopted parameters typical
of the band 1 (W1) detector on WISE: an instrumental
zero point of m0 ≈ 20.73 and a noise-sigma of 18.751
DN for a single-exposure frame. The latter corresponds to
an emprically derived 5σ limit of 15.8 mag for a
single W1 exposure.
100,000 Gaussian-noise trials were simulated for each true flux
(or count)
in the range 40 to 20,000 DN (≈ 16.72 to 9.98 mag). The simulated
fluxes at each truth value were converted into magnitudes and
various moments computed therefrom. The magnitude-space
sample moments where then compared to the true input values.
Figures 1 and 2 show the results. The bias in the sample average
is ~2% at S/N=5 and then grows appreciably after this, becoming >12%
at S/N~2.
|
|
| Figure 1 - Bias introduced from averaging a sample of repeated magnitude measurements directly as a function of true magnitude where 'fluxes' (counts) were drawn from a Gaussian noise population with mean=true DN, sigma=18.751 DN (see text). |
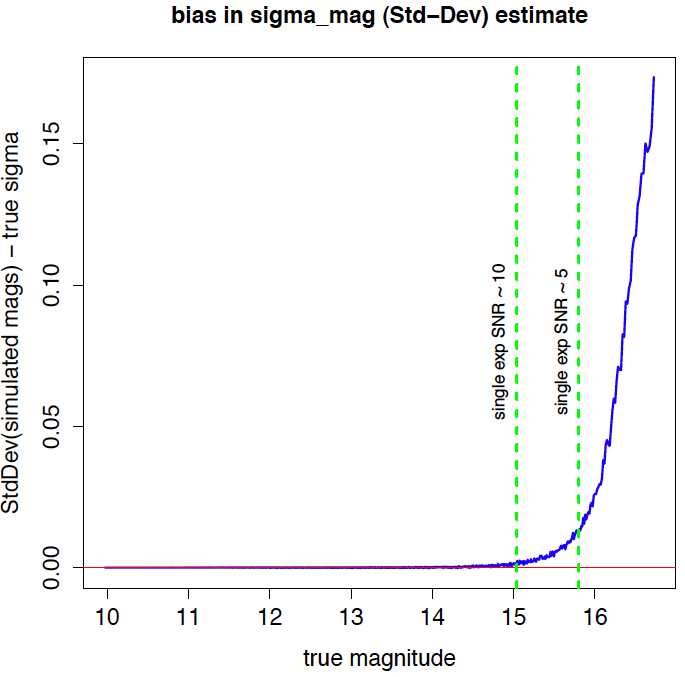 |
| Figure 2 - Bias introduced from computing the standard-deviation of a sample of repeated magnitude measurements directly as a function of true magnitude where 'fluxes' (counts) were drawn from a Gaussian noise population with mean=true DN, sigma=18.751 DN (see text). |
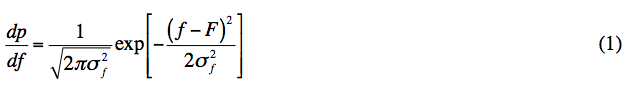
Here we derive the analytical form for the p.d.f. in magnitude space with fluxes affected by pure Gaussian noise. We start with the standard Gaussian p.d.f. in flux space with some true flux F and noise-sigma σf :
|
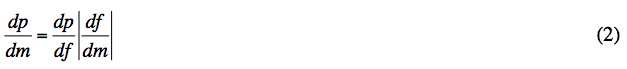
The magnitude-space p.d.f. can be derived from the following transformation relating densities in flux and magnitude space:
|
and
|
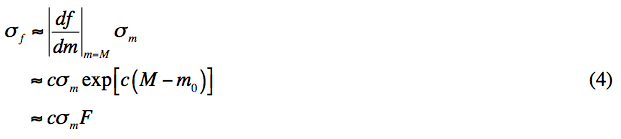
The noise-sigma in flux and magnitude space are related by:
|
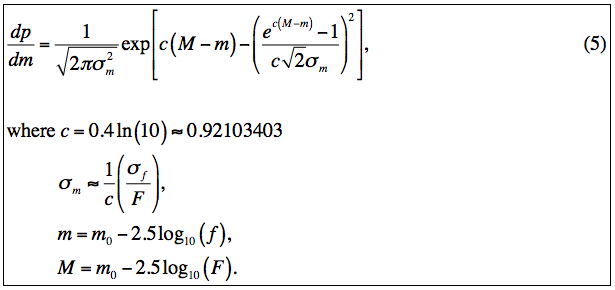
where M is the true magnitude corresponding to true flux F. The first line in Eq. (4) is actually an approximation (to first order). It is often well justified, but an expression to second order is derived here. Combining Equations 1 - 4, we have our final result:
|
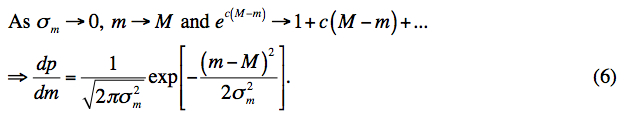
In the low noise (high S/N) limit, say S/N >~ 15, Eq. 5 reduces to a simple Gaussian, i.e.,
|
The correct p.d.f. in Eq. 5 and its often used (erroneous) approximation in
Eq. 6 are compared in Figure 3.
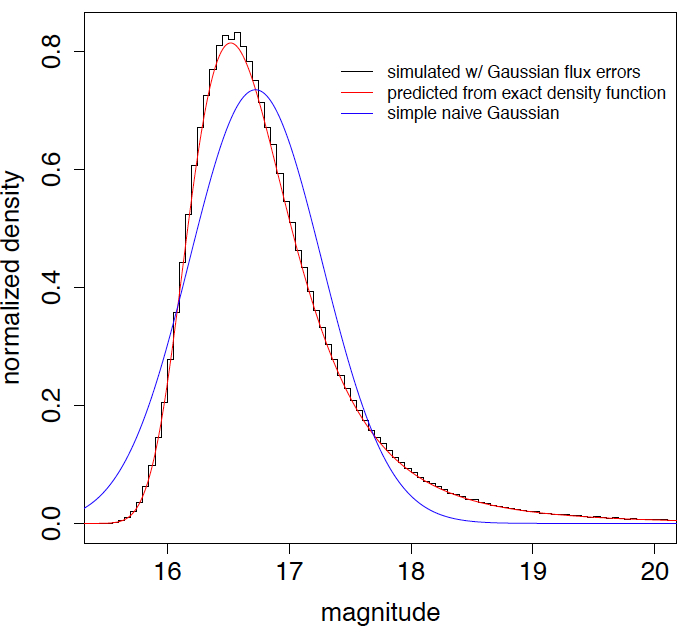 |
| Figure 3 - Simulated magnitude distribution corresponding to S/N ~ 2 [black], i.e., the lowest S/N bin in Figures 1 and 2 corresponding to truth M = 16.72 mag and σm ~ 0.54 mag. The sample average is <m> ≈ 16.86. For comparison, we show the correct density function given by Eq. 5 [red] and that predicted by the 'naive' Gaussian in Eq. 6 [blue] with mean = M and sigma = σm. |
In summary, sample moments computed directly from a set of (noisy) magnitude measurements in regimes of low S/N will be biased with respect to their true underlying values. However, moments computed from flux measurements will represent unbiased estimates of the true values, which can then be safely converted to magnitudes.
The above simulations and plots were generated using the S-Plus/R Codes:
simmagbias.r
magdensity.r