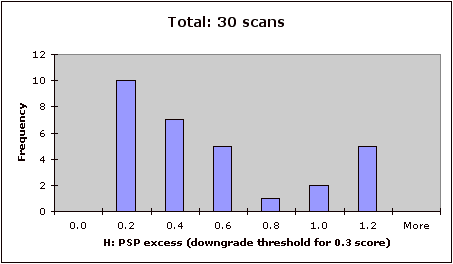
Of the tiles with a single max quality score < 5 we find the following breakdown (note that some tiles may be counted more than once if they have multiple problems, typically poor seeing that is also untracked). Numbers of scans with the same problem in the set of multiply observed tiles are noted in a separeate column. Histograms are based on the singly-observed tiles only. Reason for downgrade # tiles # mult obs -------------------- ----- -------- Sensitivity: 30 50 Here we have binned the delta H band PSP from the nominal threshold for a downgrade to 0.3 (note that there are different thresholds for the north & south, and the north further has two periods due to the array swap). About a third fall close to the threshold of quality 5 (within about 0.2). Note that this threshold corresponds to the PSP where there is a 25-50% probability that the data meet the level 1 specs. A PSP offset of 0.4 or more is in the regime where the data will not meet level 1 specs (for northern data after the H array replacement this happens after a PSP offset of 0.2). For more info see: PSP Info QA grading rules
 Seeing shape: 35
Almost all of these have just barely toggled over the threshold for
max(J shape) < 1.3, though one scan has an exceptionally poor value of
1.53. Note that a small number of scans show up under the threshold;
these were downgraded during the qa review process due to untracked
seeing resulting in an underestimate of the actual max seeing shape.
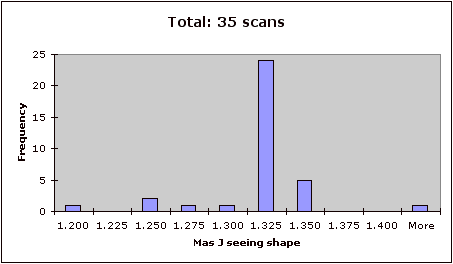
Seeing shape: 35
Almost all of these have just barely toggled over the threshold for
max(J shape) < 1.3, though one scan has an exceptionally poor value of
1.53. Note that a small number of scans show up under the threshold;
these were downgraded during the qa review process due to untracked
seeing resulting in an underestimate of the actual max seeing shape.
 Untracked seeing: 108
These are not tied to a specific threshold value but instead reflect
the results of reviewer confirmation of a distinct period in one or
more bands where the seeing was not tracked. These untracked intervals
affect only small portions of a scan (usually just a segment of a
coadd) and the primary errors introduced into the data would be possible
spurious detections of point sources. A shape error of 0.1 leads to
an expected point source photometry error of only ~7% (discussion).
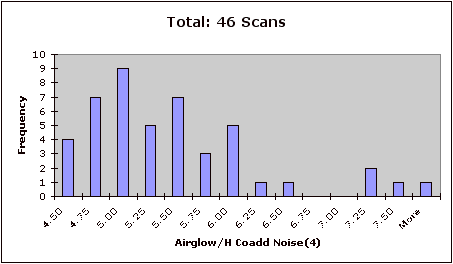
Airglow: 46 1
This shows a broad distribution of excess H band coadd noise (H airglow
is estimated by comparing the measured background coadd noise level to
that expected from the overall bkg level) exceeding the downgrade
threshold of 4.5. The reason is that in v2 the background estimates
were being incorrectly tied to the background level of the first frame.
Thus the expected levels of coadd noise would be systematically
overestimated in the later parts of the scan, causing the excess coadd
noise statistic to be systematically underestimated.
Untracked seeing: 108
These are not tied to a specific threshold value but instead reflect
the results of reviewer confirmation of a distinct period in one or
more bands where the seeing was not tracked. These untracked intervals
affect only small portions of a scan (usually just a segment of a
coadd) and the primary errors introduced into the data would be possible
spurious detections of point sources. A shape error of 0.1 leads to
an expected point source photometry error of only ~7% (discussion).
Airglow: 46 1
This shows a broad distribution of excess H band coadd noise (H airglow
is estimated by comparing the measured background coadd noise level to
that expected from the overall bkg level) exceeding the downgrade
threshold of 4.5. The reason is that in v2 the background estimates
were being incorrectly tied to the background level of the first frame.
Thus the expected levels of coadd noise would be systematically
overestimated in the later parts of the scan, causing the excess coadd
noise statistic to be systematically underestimated.
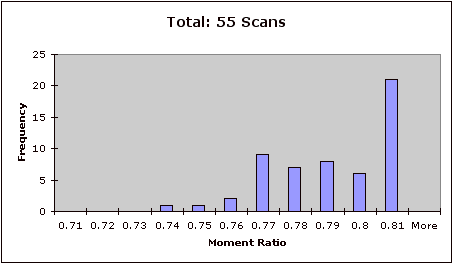
 Second moment ratio: 55
About a third of the scans show image elongations very close to the
threshold, possibly toggling over the threshold from v2 values. However
a large population shows high elongations, primarily from early '97
northern nights that were never reobserved.
Second moment ratio: 55
About a third of the scans show image elongations very close to the
threshold, possibly toggling over the threshold from v2 values. However
a large population shows high elongations, primarily from early '97
northern nights that were never reobserved.
 Photometricity-
Cloud undetected in v2: 5
These scans have compromised photometry for some segment of the scan
around the 0.1 mag level; in principle the photometric bias could
largely be removed in the database by cross-calibrating the scan
against its overlaps and deriving a correction factor that is a
function of Dec.
Bad zp soln on 971123n: 27 (entire night)
This night had very unstable photometry (no direct evidence of
clouds) with atmospheric opacity changing by as much as 0.08 mag on
timescales of < 1 hr. The worst effects are seen in the 2 cal sets
around 0915 & 1030 UT which are discrepant in all bands. Outside of
this interval the photometric stability, while not great, falls well
within our tolerances. The cal sets in question are at airmasses of
1.3 & 1.5, while the surrounding 3 sci sets are all around 1.05. Note
that the J zp's follow these strong deviations (since they are
point-point) while the linear H & K zp's follow only the more general
trends of the night.
At worst, the photometric impact would be ZP offsets of up to 0.08
mag and could manifest color biases of similar magnitude because of
the different algorithms at J and H/K. This applies to scans 049-056,
063-070, & 077-084, covering the contiguous tiles 9586-9609.
Zero-Point Plot
Bad zp soln on 990511s: 7 (last sci block of night)
The final cal set this night was dropped and the zero point solution
extrapolated through the final survey set. Overall photometry is
stable this night so the extrapolation is likely to be good, though
further validation should be made by comparing all available
overlaps.
Zero-Point Plot
Bad Zero-Point Plot
2-cal soln on 981015n: 8
Initial 2-cal interval, stable at H & K, ~0.03 mag offset at J. No
signs of clouds noted during interval. Looks reliable enough for
catalog inclusion (though extra overlaps validation would be
appropriate).
Zero-Point Plot
2-cal soln on 991013s: 6
Initial 2-cal interval stable in all bands. In v2 a 3rd cal set was
used (giving a downgrade of 0.8) but since the set was also graded
quality 0 (since it bounded no photometric data) it was not loaded
into the database and could not be used in v3. However the data look
perfectly fine with no signs of photometric problems and should be
considered catalog quality (though extra overlaps validation would be
appropriate).
2-cal soln on 991029n: 7
Initial 2-cal interval, stable at H & K, slight ~0.02 mag offset at
J. No other photometric problems noted in interval so it should be of
catalog quality (though extra overlaps validation would be
appropriate).
Zero-Point Plot
Bad zp soln on 000530s: 1 (multiply-observed tile)
Final interval with questionable zp values downgraded to 0.3 (as if it
were a 2-cal interval) due to erratic behavior of preceeding cal set.
The final cal set bounding this scan also shows a lot of dispersion
and the ZP solutions for all bands appear unreliable at the 0.02 mag
level.
Zero-Point Plot
2-cal soln on 001027n: 2 (multiply-observed tiles)
Initial 2-cal interval shows unusual trend at K band (less pronounced
at J & H).
Zero-Point Plot
2-cal soln on 001122n: 1
Initial 2-cal interval stable in all bands. However the data look
perfectly fine with no signs of photometric problems and should be
considered catalog quality (though extra overlaps validation would be
appropriate).
Zero-Point Plot
Overall scoring overrides-
Ladybugs: 46 1
No reliable quantitative diagnostics for ladybug tracks exists,
however v3 meteor blanking does an excellent job of at least
partially catching them (which is why these were flagged in v3 by the
reviewers but missed in v2). Resulting coadds are usually only partly
cleaned with residual trails persisting. A handful of these have
extensive artifacting though in most the artifacts are of moderately
low levels. Impact on point source photometry is likely to be
minimal, though in the worst cases spurious single-band detections
are generated. Spurious extended sources are likely though colors
should be highly atypical of galaxies. Individual scan inspection may
be necessary to determine what fraction are badly enough affected to
potentially exclude from the catalog.
J electronics glitches: 4
3 of these are multi-frame J glitches on 970920n; rerunning of these
scans with careful frame blanking may reduce the magnitude of the
effect, but it is unlikely that it can be completely repaired since
long runs of consecutive frames are affected. Note that the impact
is limited to a few coadds in each scan.
The single scan on 970917n could in theory be completely recovered
with a rerun after blanking the single offending frame.
Photometricity-
Cloud undetected in v2: 5
These scans have compromised photometry for some segment of the scan
around the 0.1 mag level; in principle the photometric bias could
largely be removed in the database by cross-calibrating the scan
against its overlaps and deriving a correction factor that is a
function of Dec.
Bad zp soln on 971123n: 27 (entire night)
This night had very unstable photometry (no direct evidence of
clouds) with atmospheric opacity changing by as much as 0.08 mag on
timescales of < 1 hr. The worst effects are seen in the 2 cal sets
around 0915 & 1030 UT which are discrepant in all bands. Outside of
this interval the photometric stability, while not great, falls well
within our tolerances. The cal sets in question are at airmasses of
1.3 & 1.5, while the surrounding 3 sci sets are all around 1.05. Note
that the J zp's follow these strong deviations (since they are
point-point) while the linear H & K zp's follow only the more general
trends of the night.
At worst, the photometric impact would be ZP offsets of up to 0.08
mag and could manifest color biases of similar magnitude because of
the different algorithms at J and H/K. This applies to scans 049-056,
063-070, & 077-084, covering the contiguous tiles 9586-9609.
Zero-Point Plot
Bad zp soln on 990511s: 7 (last sci block of night)
The final cal set this night was dropped and the zero point solution
extrapolated through the final survey set. Overall photometry is
stable this night so the extrapolation is likely to be good, though
further validation should be made by comparing all available
overlaps.
Zero-Point Plot
Bad Zero-Point Plot
2-cal soln on 981015n: 8
Initial 2-cal interval, stable at H & K, ~0.03 mag offset at J. No
signs of clouds noted during interval. Looks reliable enough for
catalog inclusion (though extra overlaps validation would be
appropriate).
Zero-Point Plot
2-cal soln on 991013s: 6
Initial 2-cal interval stable in all bands. In v2 a 3rd cal set was
used (giving a downgrade of 0.8) but since the set was also graded
quality 0 (since it bounded no photometric data) it was not loaded
into the database and could not be used in v3. However the data look
perfectly fine with no signs of photometric problems and should be
considered catalog quality (though extra overlaps validation would be
appropriate).
2-cal soln on 991029n: 7
Initial 2-cal interval, stable at H & K, slight ~0.02 mag offset at
J. No other photometric problems noted in interval so it should be of
catalog quality (though extra overlaps validation would be
appropriate).
Zero-Point Plot
Bad zp soln on 000530s: 1 (multiply-observed tile)
Final interval with questionable zp values downgraded to 0.3 (as if it
were a 2-cal interval) due to erratic behavior of preceeding cal set.
The final cal set bounding this scan also shows a lot of dispersion
and the ZP solutions for all bands appear unreliable at the 0.02 mag
level.
Zero-Point Plot
2-cal soln on 001027n: 2 (multiply-observed tiles)
Initial 2-cal interval shows unusual trend at K band (less pronounced
at J & H).
Zero-Point Plot
2-cal soln on 001122n: 1
Initial 2-cal interval stable in all bands. However the data look
perfectly fine with no signs of photometric problems and should be
considered catalog quality (though extra overlaps validation would be
appropriate).
Zero-Point Plot
Overall scoring overrides-
Ladybugs: 46 1
No reliable quantitative diagnostics for ladybug tracks exists,
however v3 meteor blanking does an excellent job of at least
partially catching them (which is why these were flagged in v3 by the
reviewers but missed in v2). Resulting coadds are usually only partly
cleaned with residual trails persisting. A handful of these have
extensive artifacting though in most the artifacts are of moderately
low levels. Impact on point source photometry is likely to be
minimal, though in the worst cases spurious single-band detections
are generated. Spurious extended sources are likely though colors
should be highly atypical of galaxies. Individual scan inspection may
be necessary to determine what fraction are badly enough affected to
potentially exclude from the catalog.
J electronics glitches: 4
3 of these are multi-frame J glitches on 970920n; rerunning of these
scans with careful frame blanking may reduce the magnitude of the
effect, but it is unlikely that it can be completely repaired since
long runs of consecutive frames are affected. Note that the impact
is limited to a few coadds in each scan.
The single scan on 970917n could in theory be completely recovered
with a rerun after blanking the single offending frame.
Summary of tiles with multiple observations at Q<5: Tile 13074 (Q=1): one ladybug, one untracked obs Tile 128859 (Q=1): twice has airglow 18 other tiles have multiple Q=3 observations, primarily due to sensitivity downgrades. 4 are regular tiles, and 14 are gap-fills.