 |
| The empirical SEDs for the six "warm" ULIGs. |
| Contents | |
| 1. | Overview |
| 2. | Construction of Empirical ULIG SEDs |
| 3. | Observed ULIG Colors |
| 4. | Maximum Redshift of Detectable ULIGs |
| |
| The empirical SEDs for the six "warm" ULIGs. |
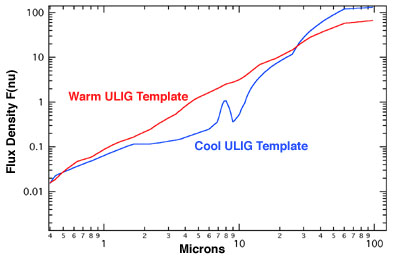 |
| The SED templates for the "warm" and "cool" ULIGs. |
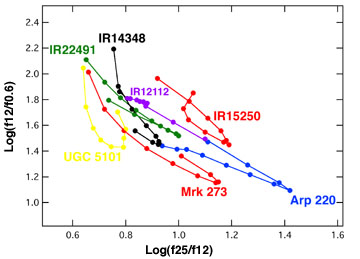 |
| Optical/mid-IR colors of cool
ULIGs, illustrating the wide range of colors. They are roughly defined by Log(f25/f12)+Log(f12/f0.6) > 2.4. The dots are in units of z=0.1. |
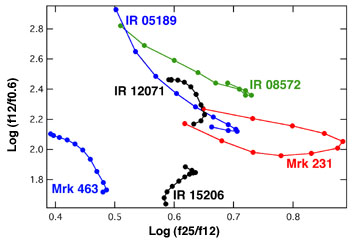 |
| Optical/mid-IR colors of warm
ULIGs, illustrating the wide range of colors. |
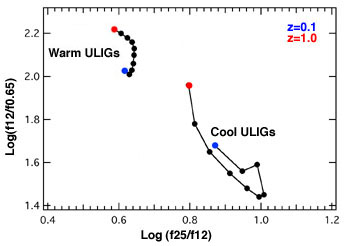 |
| Optical/mid-IR colors of warm and cool ULIG galaxy templates. |
| "Cool" ULIGs | max z |
| UGC 5101 | 1.2 |
| IR 12112 | 1.4 |
| Mrk 273 | 1.2 |
| IR 14348 | 1.4 |
| IR 15250 | 1.4 |
| Arp 220 | 1.2 |
| IR 22491 | 1.4 |
| "Warm" ULIGs | |
| IR 05189 | 2.4 |
| IR 08572 | 2.1 |
| IR 12071 | 2.0 |
| Mrk 231 | 2.9 |
| Mrk 463 | 2.5 |
| IR 15206 | 1.7 |