Instructions for WIRESAOTNG
WIRESAOTNG is a new version of SAOTNG which has a few new features which make it
easier to analyze WIRE data via Tom Barlow's web heirarchy. There are also Debbie's instructions on how to set up SAOTNG.
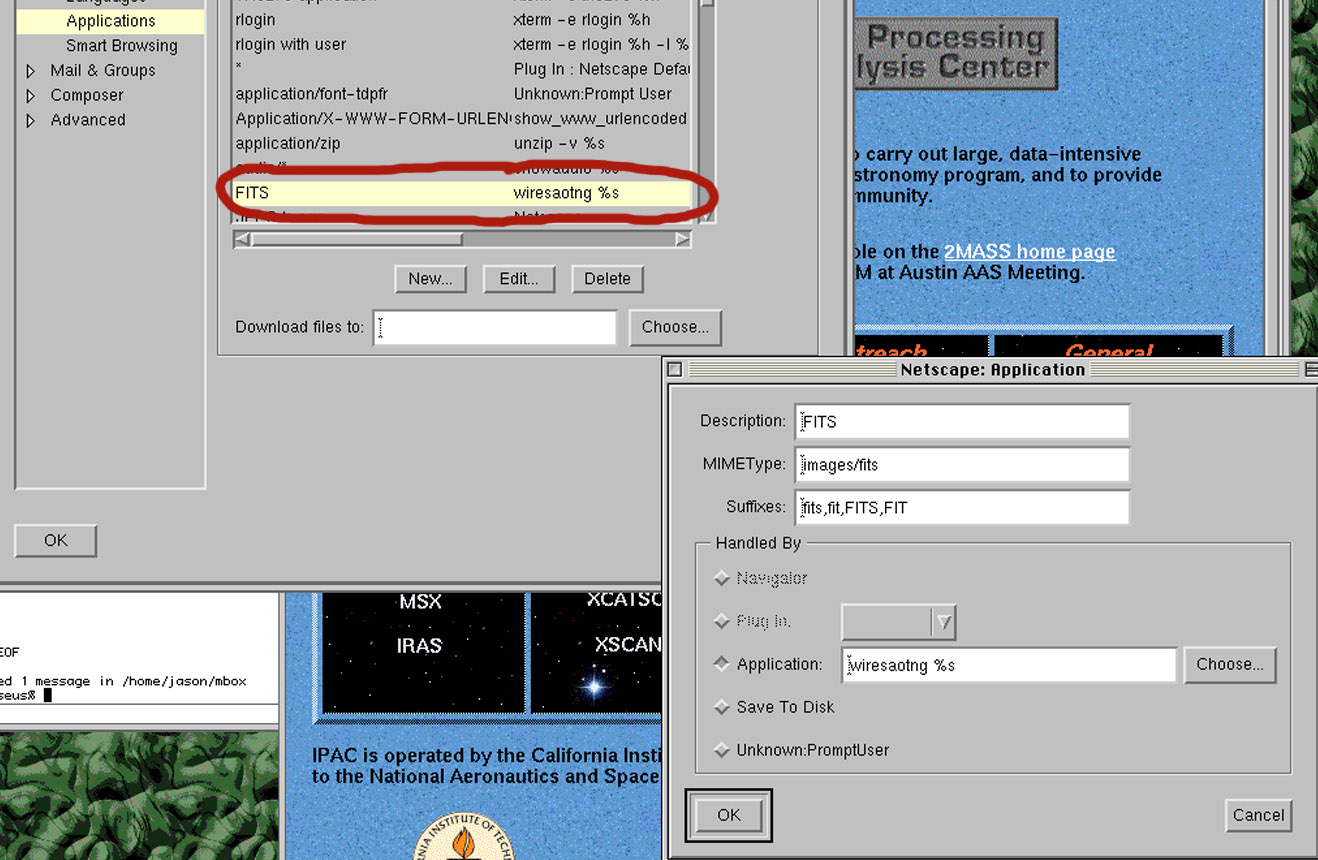
To configure Netscape to use this as your default fits viewer, fill in the
preferences option as detailed below (press the image link for a close-up).
The only other thing you need to do is to copy the default config file to
your user directory i.e.,
cp /proj/wire/include/wire.wiresaotng ~

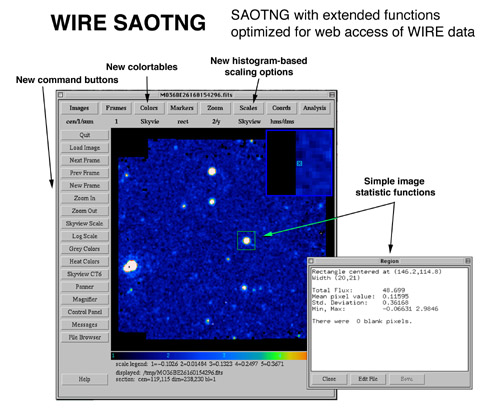
Summary of New Features and Usage
1) Skyview color tables are now available. These may be selected from the "Colors" menu option at the top. Skyview color table 6 is now the default, and
it can be selected by pressing the button on the left.
2) Several new buttons have been added on the left. The most useful is the
"quit" button, which speeds up going through the images.
3) There are two new histogram-based scaling options. These may be selected from the "scales" menu at top. The first is a skyview scaling option, which
is based on the noise distribution in the image. It may also be selected from
the button on the left. The second is a histogram-based 1-95% pixel option
based on "imxlat". Note that both of these options take a few seconds.
4) The default stretch is now "log".
5) From the "analysis" menu you can get statistics about the entire image.
6) Region statistics.Drag the right mouse button to define a rectangular
region. Place the cursor in the region (the region will "light up").
Hold the left mouse button - a pop-up menu appears. Choose marker analysis-
region statistics. After a couple seconds a textbox pops up with handy info in it.