Systematic Distortion of Fluxes over Specific Flux
Ranges
There is a systematic error in the faint fluxes reported in the SWIRE
version 1 release. Although this flux distortion is mentioned in Section
7.2.1 of the data release paper, we feel that it is sufficiently
significant as to warrant further discussion here. During validation a
point-by-point photometric comparison was made between catalogs extracted from
the SWIRE
survey data in ELAIS N1 and from a much deeper pointing the same region
used to validate the GOODS survey strategy and released as part of the
extragalactic First Look Survey. This comparison is shown below for each
of the four IRAC channels. Note particularly for the 4.5 micron data the
SWIRE fluxes are underestimated by on order of 20 percent relative to the
FLS data, and at relatively high flux levels (20 microJy).
It is now understood that this error originated with the way the MOPEX
software was used to mosaic the IRAC data. The default single frame outlier
rejection was used (in conjunction with MOPEX's other outlier rejection
schemes) and this choice was later found to be the source of the
problematic fluxes. Data reprocessed without any outlier rejection lacked
this problem, and the specific issue was isolated by further investigation
and comparison to the FLS pipeline. Since the error occured during
coaddition, the error lies in the images themselves, and not in the
photometric extraction. Although the FLS data were also coadded using
MOPEX, the depth of coverage of the FLS data was noticeably higher,
minimizing this error. The Version 2 release of the SWIRE data will have
this effect corrected.
For clarity we show here two important ways that this error will manifest
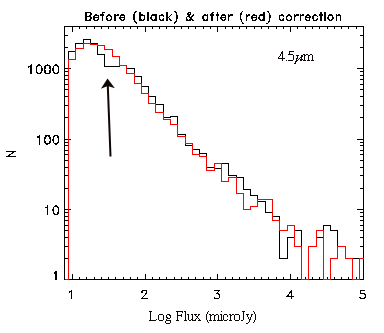
itself. The first is a distortion in the number
counts at faint flux
levels. Due to the flux underestimation, objects are shifted from one bin
down into lower flux bins. This results in a notch or shoulder in the
number counts.
 |
| 4.5 micron number counts, showing the distortion in the counts due
to objects being shifted to lower flux bins. Shown are the released survey
in N1 vs. counts in XMM, which have been processed with the new
software. |
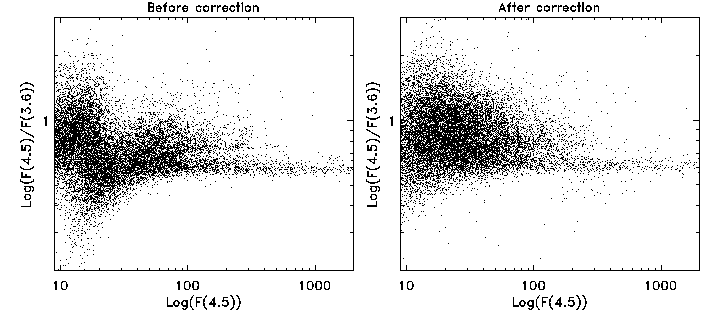
The second important effect is on the observed colors.
The following figure presents color-magnitude diagrams for data processed
in the same manner as in the version 1 data release, and using new
processing with the processing error fixed.
 |
| Distortion in 3.6/4.5 colors processed as in Version 1 (left) and
with corrected processing (right). |