Thoth, v. 5.9
Russ Laher (laher@ipac.caltech.edu)
IPAC, California Institute of Technology, MC 100-22, Pasadena, CA 91125
Copyright © 2010-2023, All rights reserved.
ATTENTION: Thoth now requires Java 1.8 or higher to run properly.
Built the Thoth.jar file on a MacBook Pro laptop under macOS Big Sur, Version 11.7.4
using apache-ant-1.9.16 and 1.8.0_333. The Thoth.jar file is platform-independent,
of course, and can be run on any computer with available Java 1.8 or
higher, such as Windows, Macs, Linux, etc.
Software Description
Thoth is a powerful graphical user interface (GUI) for querying, displaying, visualizing, and
analyzing tabular data stored in relational databases and files. A
data query in the context of this software is defined as either a SQL query
(Structured-Query-Language query) or the simple importation of tabular
data from a file.
The software is easy to use and configurable for most databases. The software's database-connection
manager organizes and stores connection parameters associated with
one or more databases for ready-access across Thoth
sessions. Both free-form and canned database
queries are handled by the software. The canned database queries are stored in
plain-text "property" files (in the Java-computer-language sense), which can be edited as needed.
Multiple databases of various types, relational databases and data files
alike, can be queried or imported within a single software session.
It is helpful to generally consider the query results, and the results
of data importation from a file, as data tables, which are referred to
here as "Thoth tables".
Scatter plots, histograms (1-D & 2-D), pie charts, ring charts, Gantt charts, line
charts, step charts, bubble charts, polar charts, area charts,
box-and-whisker charts, spider-web charts, and bar/column charts
can be constructed by the software for user-selected table columns
within a given Thoth table via easy-to-use control panels.
These graphs are readily customized into publication-ready format, and
can be copied to the system clipboard, captured from the computer screen,
sent to a printer, and/or saved as a
PNG image. A wide variety of statistics are also computed
for user-selected numerical-data table columns within a given Thoth table by clicking on the
GUI's "Statistics" button.
 The query results and imported tables are displayed in tabbed panes on
the Main-GUI panel as so-called Thoth tables.
They are also automatically saved in a SQLite scratch database
called "thoth.db" in the invisible ".Thoth" directory in the user's home
directory. The assigned table names in the scratch database are "Thoth#", where
# is incremented starting from zero after each data table is saved.
The scratch database is thus a portable database that is
potentially gleaned from multiple sources, and, since it is contained within a single file,
it can be conveniently renamed or copied as needed. Thoth, or any SQLite-database tool,
can be used to access the scratch database. The scratch database
is deleted and regenerated from scratch at the beginning of each Thoth
session. When a tabbed pane for a table is closed on the Main-GUI
panel (via the red "x" button on the tabbed pane), the table is also removed from the scratch database.
A Thoth table within the aforementioned SQLite scratch database
defines the limit of the scope of Thoth's data analysis and visualization. Database
queries can join multiple Thoth tables into a single Thoth table for
enlarging this scope. For example, a scatter plot with multiple
series must be constructed from the data columns within a given Thoth table.
This is a fundamental limitation of Thoth's architecture, like it or not.
Thoth is implemented in the Java programming language, which uses
standard JDBC (Java Database Connectivity) to access relational databases. All
required Java packages are included in the software distribution.
Database drivers for MySQL, PostgreSQL, HyperSQL, Oracle,
and SQLite databases are also included.
If a different database is to be used, then the associated driver jar file
should be copied into the lib directory or another location, and this
location should added to the CLASSPATH environmental variable.
Version 1.8.0_333 or greater of the Java Virtual Machine is required to
execute Thoth, and this must be pre-installed on the user's machine
from a distribution package downloaded from the Oracle Java website.
The query results and imported tables are displayed in tabbed panes on
the Main-GUI panel as so-called Thoth tables.
They are also automatically saved in a SQLite scratch database
called "thoth.db" in the invisible ".Thoth" directory in the user's home
directory. The assigned table names in the scratch database are "Thoth#", where
# is incremented starting from zero after each data table is saved.
The scratch database is thus a portable database that is
potentially gleaned from multiple sources, and, since it is contained within a single file,
it can be conveniently renamed or copied as needed. Thoth, or any SQLite-database tool,
can be used to access the scratch database. The scratch database
is deleted and regenerated from scratch at the beginning of each Thoth
session. When a tabbed pane for a table is closed on the Main-GUI
panel (via the red "x" button on the tabbed pane), the table is also removed from the scratch database.
A Thoth table within the aforementioned SQLite scratch database
defines the limit of the scope of Thoth's data analysis and visualization. Database
queries can join multiple Thoth tables into a single Thoth table for
enlarging this scope. For example, a scatter plot with multiple
series must be constructed from the data columns within a given Thoth table.
This is a fundamental limitation of Thoth's architecture, like it or not.
Thoth is implemented in the Java programming language, which uses
standard JDBC (Java Database Connectivity) to access relational databases. All
required Java packages are included in the software distribution.
Database drivers for MySQL, PostgreSQL, HyperSQL, Oracle,
and SQLite databases are also included.
If a different database is to be used, then the associated driver jar file
should be copied into the lib directory or another location, and this
location should added to the CLASSPATH environmental variable.
Version 1.8.0_333 or greater of the Java Virtual Machine is required to
execute Thoth, and this must be pre-installed on the user's machine
from a distribution package downloaded from the Oracle Java website.
Troubleshooting and Bug Reporting
If you experience unexpected behavior from the software, try looking at the output in
the terminal window where you are executing the software. If Thoth was
launched by clicking on a Folder-window icon, there may not be
any terminal-window output available, but some debugging information
can be found in the javastdout.log and env.txt files located
in the invisible ".Thoth" directory in the user's home
directory. If further debug info is needed, it is recommended that
Thoth be executed from a terminal window with a command like the
following one (the THOTH_HOME environment variable should be set to
the path of the Thoth.jar file):
java -Duser.language=en -Duser.region=US -Xmx8192M -jar ${THOTH_HOME}/Thoth.jar
If you find a bug, please e-mail Russ Laher (laher@ipac.caltech.edu).
Contents
The installation instructions for Thoth are at the following URL:
http://web.ipac.caltech.edu/staff/laher/thoth/
It is necessary to configure a database connection if you are going to
query a database for tabular data. You can configure multiple
database connections in Thoth. If you plan to use Thoth to just
import tabular data from files, then database connections need not be
configured.
The "Connections" button brings up a database-connection manager that
makes it easy to set up database connections. The "New" tab brings up
a blank form with the following fields: Connection moniker, JDBC
driver, database URL, database user name, database password, default
database query. The connection moniker is simply a nickname for your
database that can be easily recognized. Examples of how to specify
the JDBC driver and database URL are given below. The database user
name and password are not always required, in which case, they can be
left blank. Sometimes a user name, but not a password is needed. The
default database query is a test SQL select statement that is specific
to each database and should be kept short (e.g., limit the number of
returned rows to just one).
Examples of JDBC drivers for common databases:
org.sqlite.JDBC
org.postgresql.Driver
com.mysql.jdbc.Driver
org.hsqldb.jdbc.JDBCDriver
oracle.jdbc.pool.OracleDataSource
Examples of database URLS:
jdbc:sqlite://Users/laher/russ.db
jdbc:postgresql://ptfsdm1.ipac.caltech.edu/ptf7
jdbc:mysql://localhost/test
jdbc:hsqldb:file:/Users/laher/hsqldb-2.3.1/hsqldb/hsqldb/hemrajdb
jdbc:postgresql://localhost/starplex
jdbc:postgresql://ptfsdm2.ipac.caltech.edu:5433/ptftr1
jdbc:sqlite:C:\\Databases\\russ.db
The last example is for a Windows machine (double backslashes are used
as subdirectory delimiters, instead of forward slashes).
After new database connections are added, the user must save them
via the following menu-bar options:
Thoth > Preferences > Save Preferences
In the saved ~/.Thoth/thoth.run.properties file, where the preferences are
stored, all colons therein will be preceded by a backslash
character that is automatically inserting when saving the preferences,
but this backslash character before each colon need not be entered into the connection-manager form.
IMPORTANT: Remember to keep saved database passwords private via
chmod 600 ~/.Thoth/thoth.run.properties
- Enter database query into the text area at the top of
the Main-GUI panel, or click on the "Select Query" button
to choose from a list of canned queries (assuming you have set
up your canned queries; see the installation instructions
for more on that). In the case of the
latter, the canned query is loaded into the text area and
can be edited, if desired.
- Click on the "Submit Query" button to submit the query to the
database server. The returned results will be displayed in
the lower portion of the Main-GUI panel. As an alternative to
querying an SQL database, you can import tabular data from a
file, via the "Import Table" button.
- Click on the "Plot Results" button for user-customizable graphs.
- Click on the "Statistics" button to select data column(s) for
which to compute various statistical results.
- Repeat above steps for each database query or file import of interest!
Note that querying or importing extremely large tables may be memory
intensive and time consuming, and may cause memory swapping.
Tables from database queries and file imports are displayed in
tabbed panes in the lower part of the Main-GUI panel. Moreover, each table
is displayed in two subordinate tabbed panes, each containing either
a cell-base spreadsheet or tabular-formatted plain text.
The plain-text representation of the table includes, if present,
the IPAC-table header or the FITS-table header. Thus, Thoth
is a convenient tool for viewing all FITS headers contained within a FITS table file.
A backslash is prepended to all header lines for
easy parsing (following the IPAC-table convention).
Thoth has controls for creating graphs in publication-ready format.
The following graph types are supported, thanks to the JFreeChart
library (http://www.jfree.org) and the Orson Charts library
(http://www.object-refinery.com/orsoncharts):
- Scatter plots
- 1-D Histogram plots
- 2-D Histogram (or density) plots
- Pie charts
- Ring charts
- 2-D Bar (or column) charts
- 2-D Stacked-bar (or -column) charts
- Line charts
- Step charts
- Area charts
- Polar charts
- Bubble charts
- Box-and-whisker charts
- Spider-web charts
- Gantt charts
- 3-D Stacked-bar (or -column) charts
- 3-D Surface charts
Examples of the various available graphs that can be generated by
Thoth are given below in this section, except for an example box-and-whisker
chart, which is given in the Statistics section that follows.
Many graph customizations are possible,
including precise selection of data-series color, symbol for data
points, and data-curve line type and widths. Data curves without data
symbols and data points not connected by lines are options.
Extensive work
has been done on the scatter-plot capability to make Thoth suitable
for plotting lightcurves, including axis inversion (for brighter
sources with decreasing magnitudes) and the ability to show
multiple data series on a single scatter plot.
Error bars can be optionally added to data points in the scatter plots,
along both domain and range dimensions.
The menu of graphs is displayed by clicking on "Plot Results" button on the
Main-GUI panel. This menu will be displayed after a table is loaded with at
least one numerical column and two data rows (not counting the header row).
Each time a graph button is clicked, a new graph is displayed, and
previously displayed graphs are not destroyed. This software behavior
allows users to create and compare graphs from different settings.
Users must exercise some discipline in closing graph windows
themselves, in order to prevent proliferation of graphs on their
computer screens.
Other things to know about the graphs:
- Click on the graph to display plot coordinates at the
mouse-cursor position (scatter plots and histograms only at this time).
- The graphing software cannot handle very large or very
small numbers, and responds by creating a graph with no numbers
on the affected graph axis. If this is encountered, adjust the
range of the graph's axes as needed until the problem goes away.
- Drag the mouse cursor across the graph to narrow the range of plotted data.
- Right-click the mouse on the graph to zoom in/out, save as
PNG image, copy to system clipboard, print, etc.
(Mac users will need a "mighty mouse" or two-button mouse, and will
also have to configure the mouse under "System Preferences" to set up
the right-click button).
- Bad data values include NaNs (not a number), Infs (infinity),
null values, blank values, etc. These are omitted from the
graphs generated by Thoth.
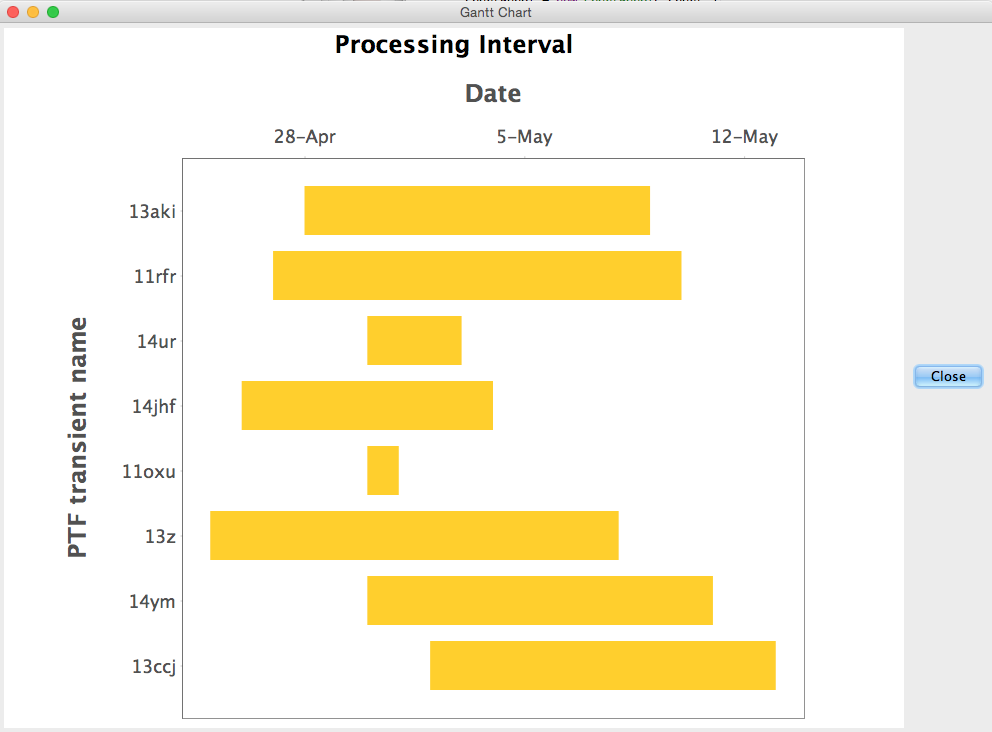
- Gantt charts can be made with start/end columns that are either
TIME, DATE, or TIMESTAMP data types. Currently, all instances of a given
data type must have the same format (here are a variety
of allowed examples from the Java SimpleDateFormat class:
"yyyy-MM-dd HH:mm:ss.SSS", "yyyy-MM-dd HH:mm:ss", "yyyy-MM-dd", "HH:mm:ss.SSS", "HH:mm:ss", etc.).
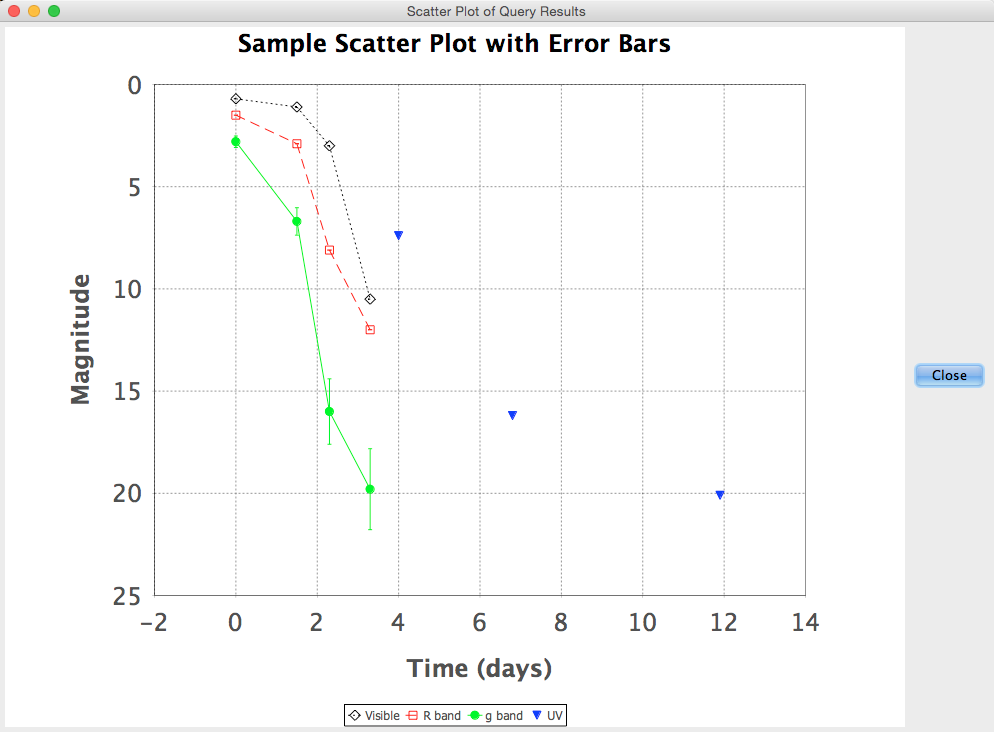
Example Scatter Plot
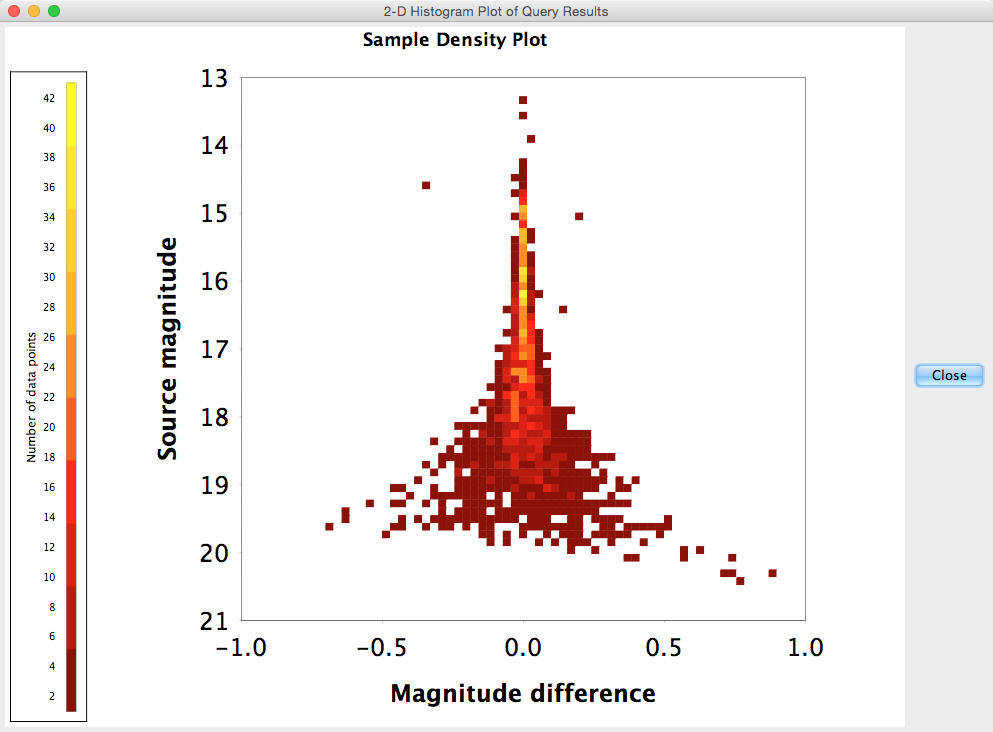
Example Density (2-D Histogram) Plot
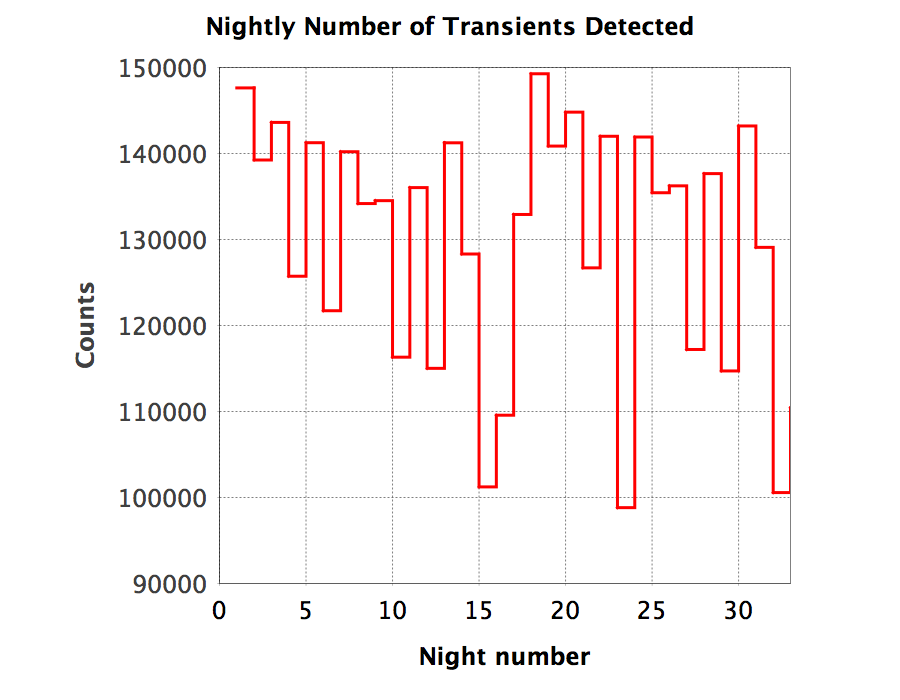
Example Histogram Plot
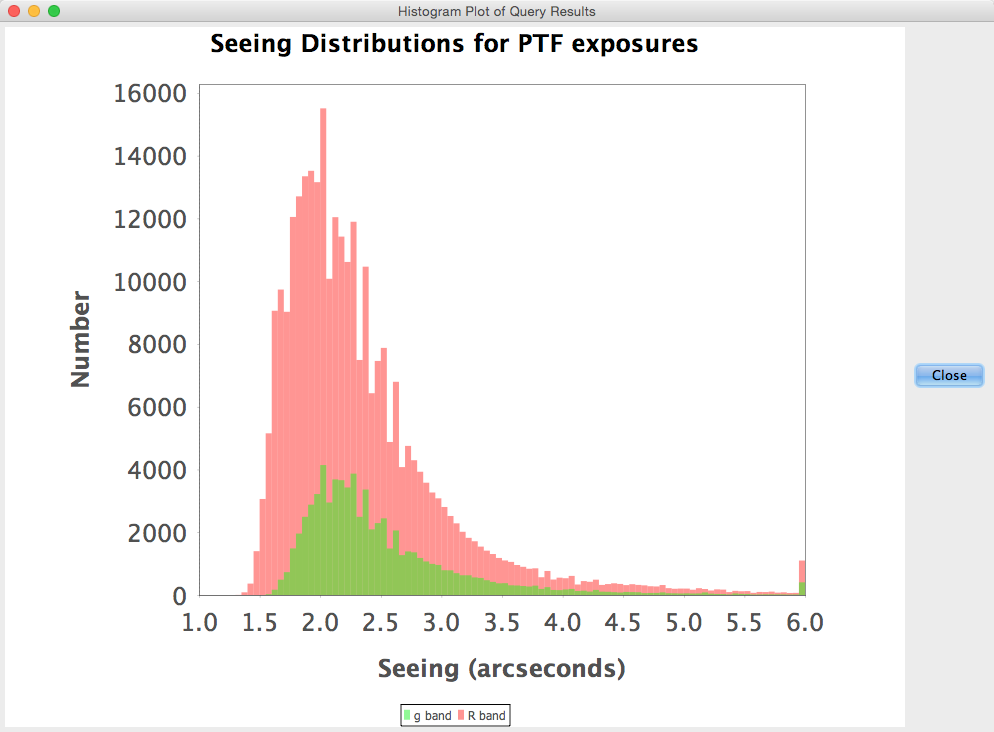 The above histogram plot with two histograms was made from
the data table returned by the following complex database query in the PTF
operations database that includes separate cases for g- and R-band exposures:
The above histogram plot with two histograms was made from
the data table returned by the following complex database query in the PTF
operations database that includes separate cases for g- and R-band exposures:
select expid,
case when fid = 1 then seeing
        else NULL
end as see1,
case when fid = 2 then seeing
        else NULL
end as see2
from exposures
where fid in (1,2)
and domestat = 'open'
and itid = 1
and obsdate > '2009-03-01'
order by expid;
Example Bar Chart
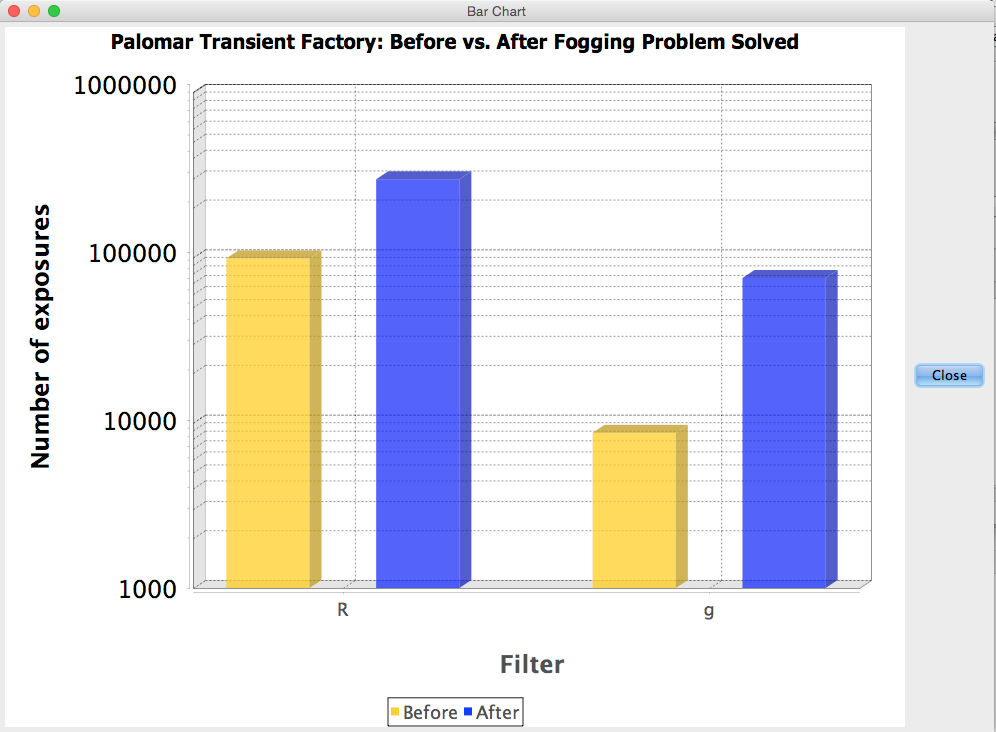 The above bar chart has two series, and the bars have been
three-dimensionally rendered. The chart was made via the following
three database queries. The first two queried the PTF operations
database and the last one queried the Thoth scratch database to put
the two tables together.
The above bar chart has two series, and the bars have been
three-dimensionally rendered. The chart was made via the following
three database queries. The first two queried the PTF operations
database and the last one queried the Thoth scratch database to put
the two tables together.
select filter, count(*)
from exposures a, filters b
where a.fid=b.fid and a.fid in (1,2) and obsdate < '2010-09-02' group by filter;
select filter, count(*)
from exposures a, filters b
where a.fid=b.fid and a.fid in (1,2) and obsdate &ge '2010-09-02' group by filter;
select a.filter, a.count as before, b.count as after
from thoth1 a, thoth2 b
where a.filter = b.filter;
Results from third query:
| filter | before | after |
| R | 98510 | 296625 |
| G | 8683 | 75009 |
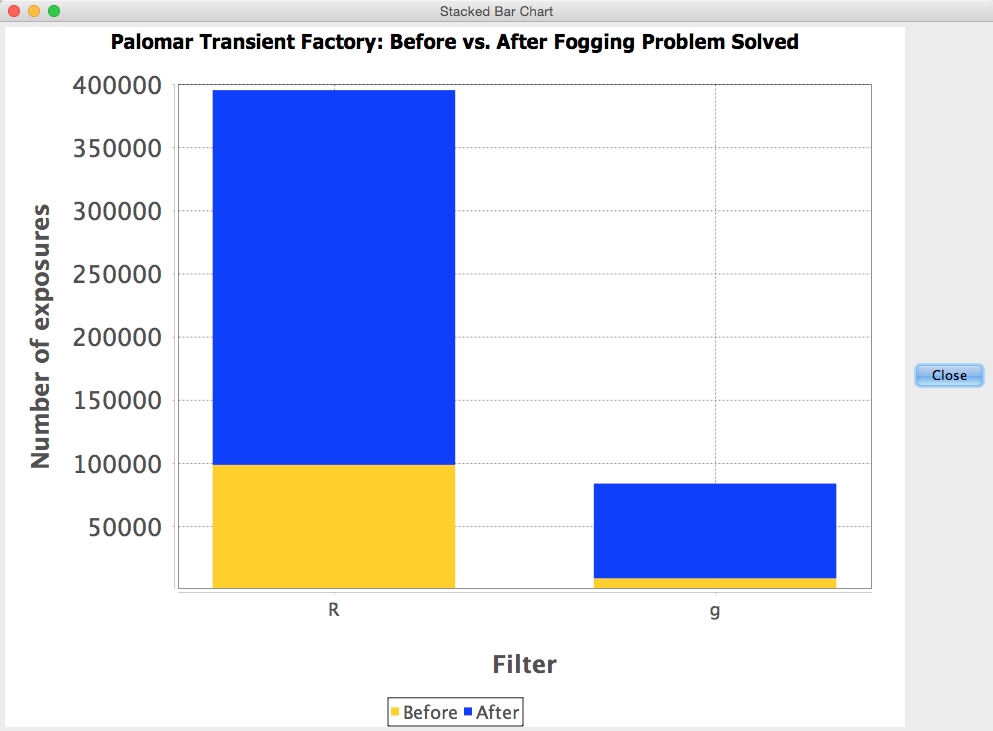
Example Stacked-Bar Chart
The stacked-bar chart below displays the same data as the bar chart
above, but in the stacked-bar format. The stacked-bar chart, as shown, has a
linear range axis, and two-dimensionally rendered bars, unlike the bar
chart above, which features a logarithmic range axis and
three-dimensionally rendered bars.
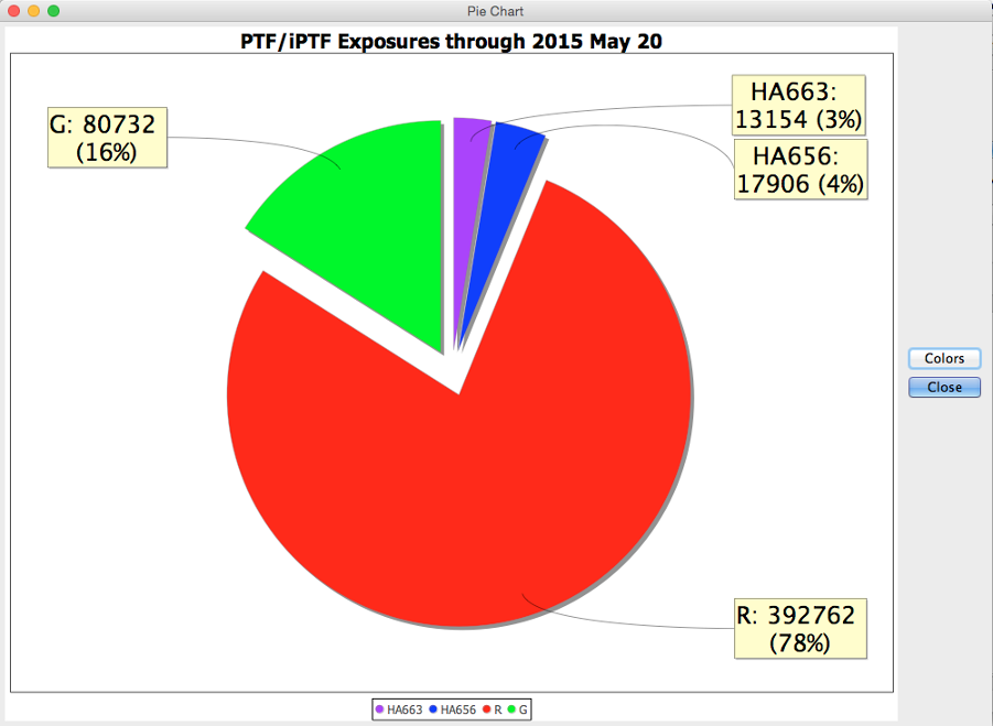
Example Pie Chart
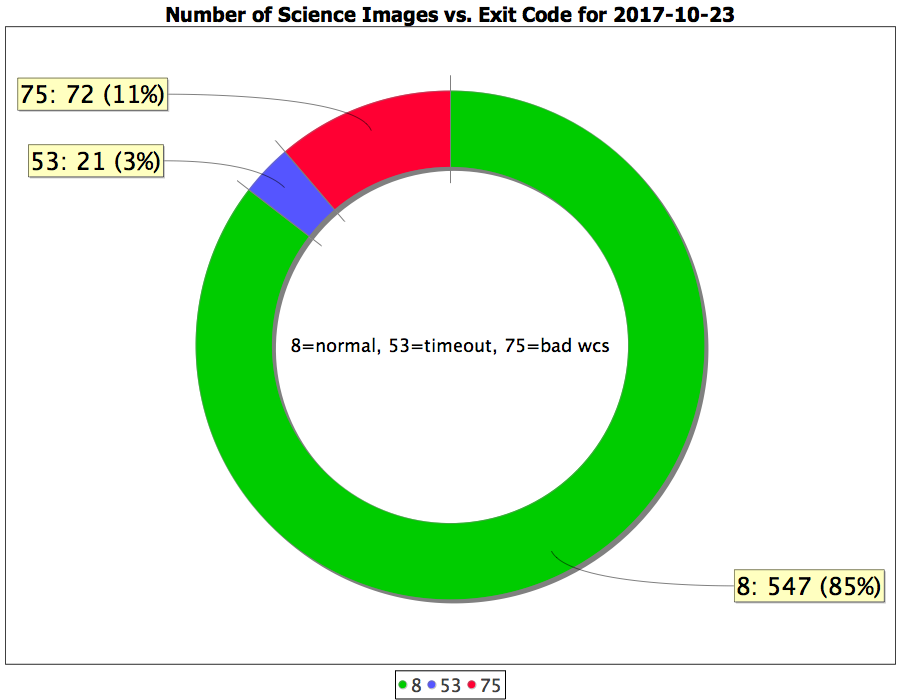
Example Ring Chart
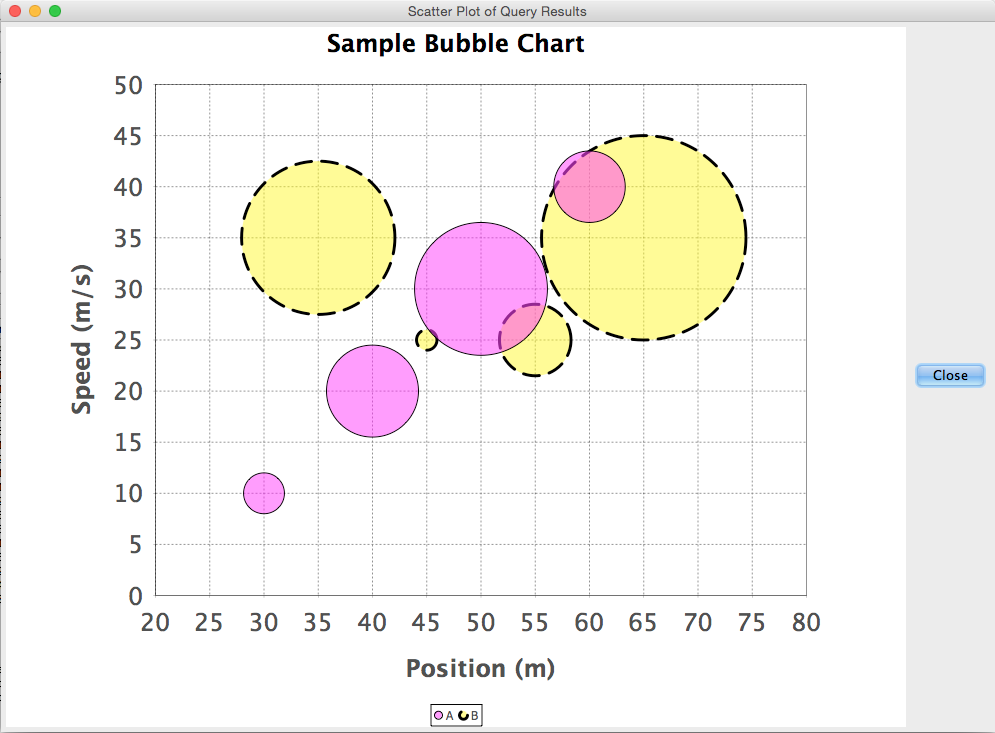
Example Bubble Chart
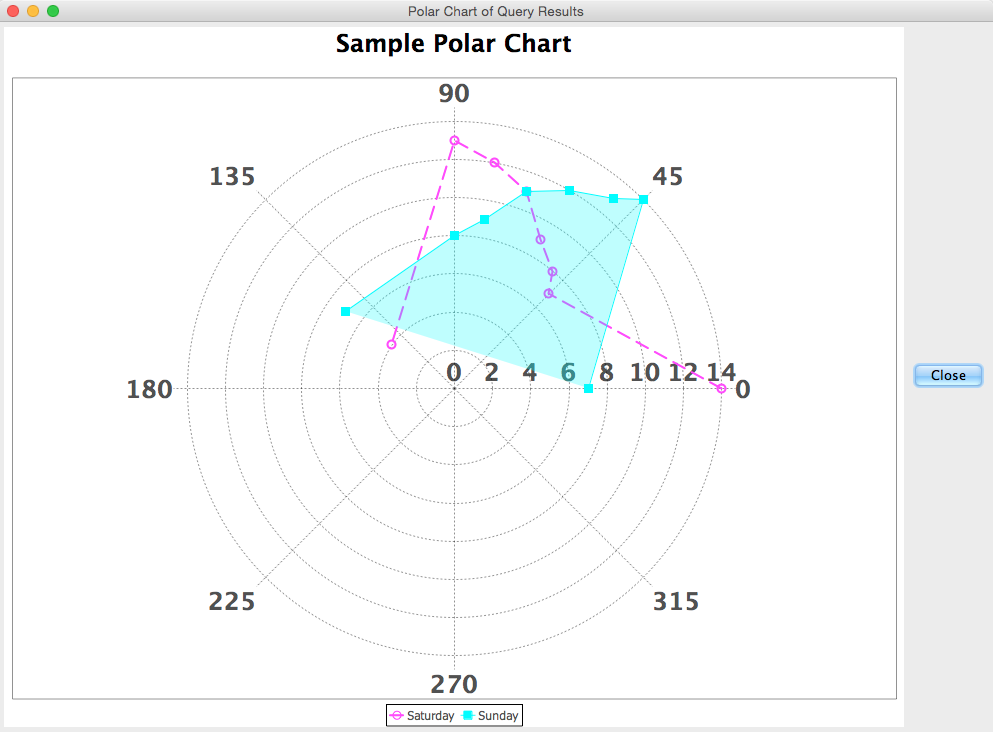
Example Polar Chart
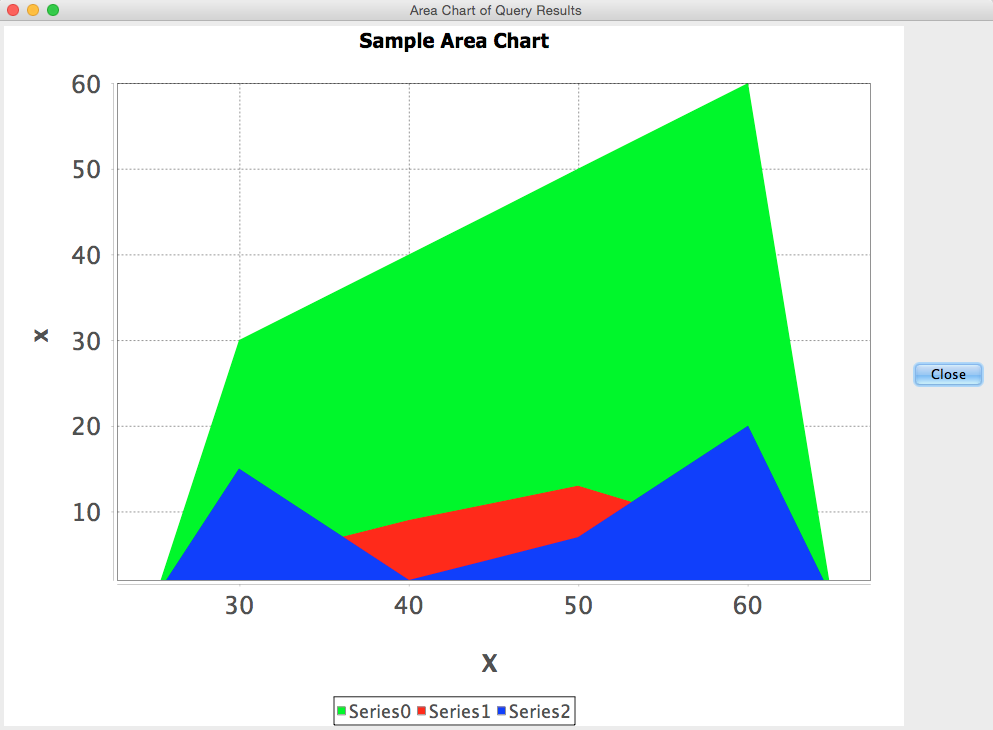
Example Area Chart
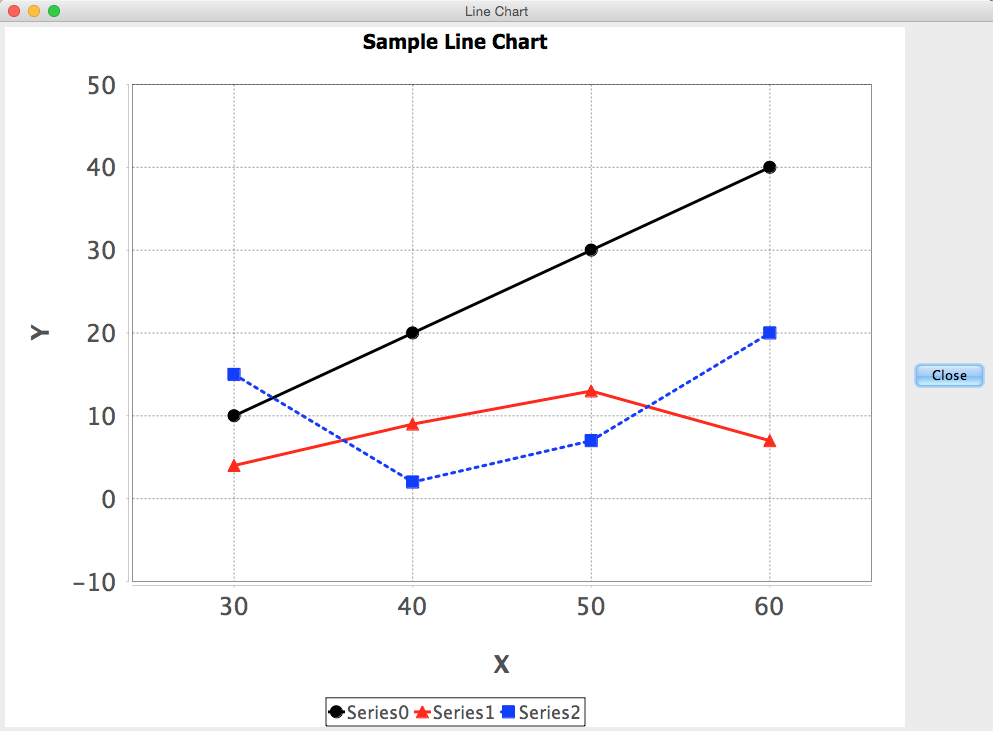
Example Line Chart
Example Step Chart
Example Gantt Chart
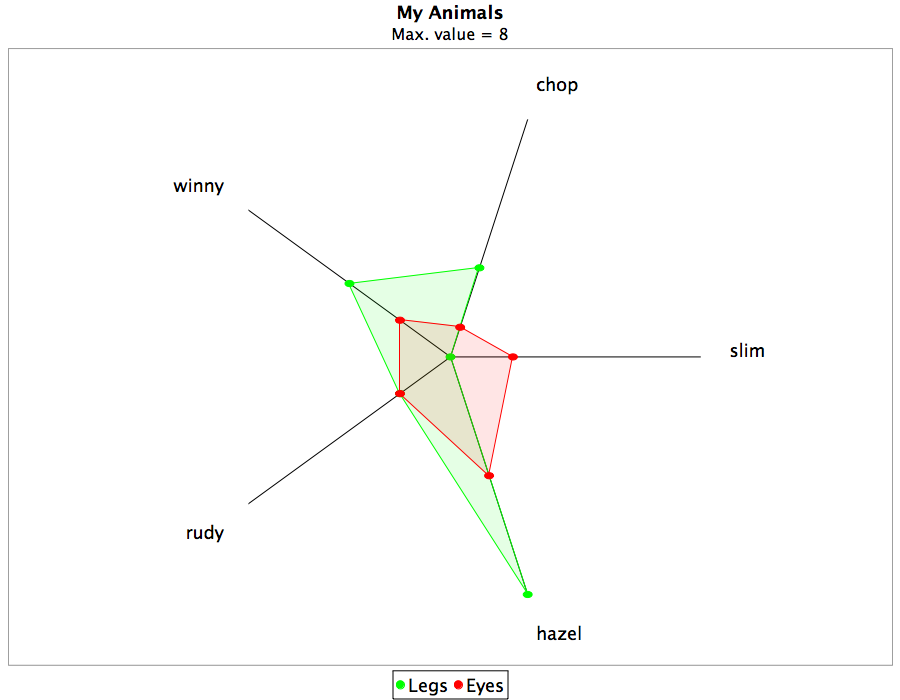
Example Spider-Web Chart
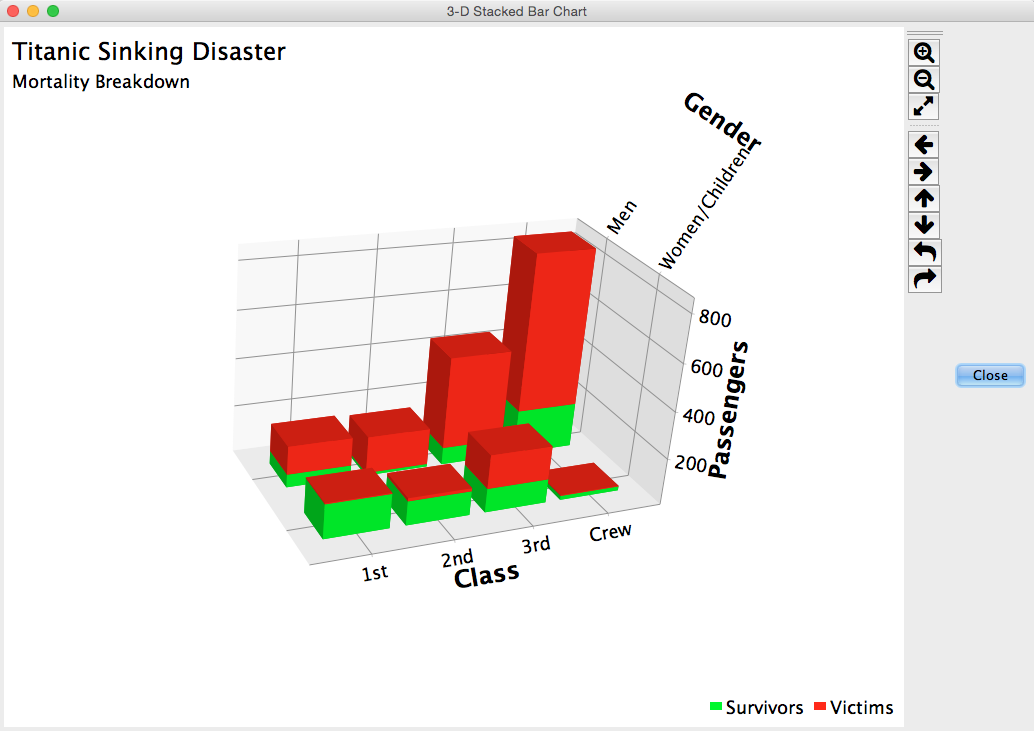
Example 3-D Stacked-Bar Chart
The 3-D stacked-bar chart below, created with Thoth, is a basic reproduction of the example
given by David Gilbert for the Orson Chart Library, which is indeed the
library that enables Thoth to do 3-D plotting:
http://www.jroller.com/dgilbert/entry/creating_3d_charts_in_java
Here is the data table used to create the 3-D stacked-bar chart in the
example:
| gender | class | survivors | victims |
| Women/Children | 1st | 146 | 4 |
| Women/Children | 2nd | 104 | 13 |
| Women/Children | 3rd | 103 | 141 |
| Women/Children | Crew | 20 | 3 |
| Men | 1st | 57 | 118 |
| Men | 2nd | 14 | 154 |
| Men | 3rd | 75 | 387 |
| Men | Crew | 192 | 670 |
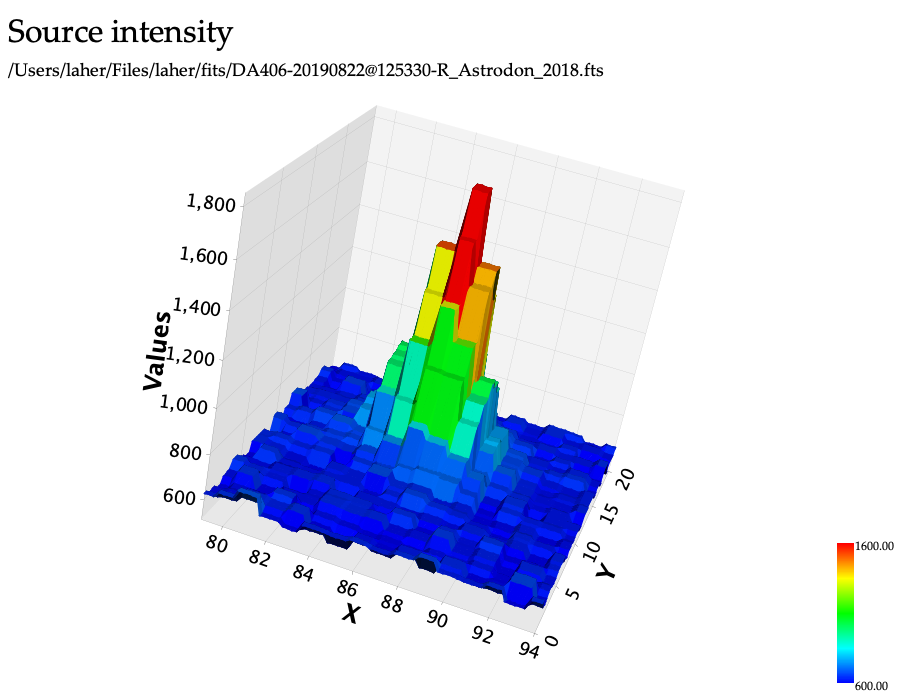
Example 3-D Surface Chart
Using SQL statement to combine tables
A scatter plot with multiple
series must be constructed from the data columns within a given Thoth table.
This is a fundamental limitation of Thoth's architecture, which may be
lifted/improved in a future software version.
Suppose one has two separate data tables, Thoth1 and Thoth2, which are to be combined for
plotting two different series on the same scatter plot:
Thoth1
x y
1 2
2 4
3 9
4 12

Thoth2
x y
3 11
4 16
5 25
6 36
Here is a SQL statement for combining the two tables into a single table:
select a.x as x1, a.y as y1, null as x2, null as y2 from thoth1 a
union
select null as x1, null as y1, b.x as x2, b.y as y2 from thoth2 b
order by x1, x2;
x1     y1     x2     y2     rownum
NULL   NULL   3      11     1
NULL   NULL   4      16     2
NULL   NULL   5      25     3
NULL   NULL   6      36     4
1      2      NULL   NULL   5
2      4      NULL   NULL   6
3      9      NULL   NULL   7
4      12     NULL   NULL   8
One can now plot y1 versus x1 and y2 versus x2 on the same scatter plot.
The current settings for any graph can be saved and loaded.
For example, for the 2-D histogram plot, the graph settings are
saved to and loaded from a property file in the
"plots/hist2d" subdirectory of the hidden directory, of which the
property filename is required to be of the following form:
"thoth.plot.hist2d.*.properties"
(where * is a user-selectable mnemonic word to associate the
graph settings with a task, project, etc.),
or "thoth.plot.hist2d.properties", the
default property filename for 2-D histogram plots.
Similar namespace allocations for all the graph types have
been designated, and are listed in the following table.
| Plot type | plots/subdirectory | Default filename for saving graph settings |
| Pie chart | pie | thoth.plot.pie.properties |
| Ring chart | ring | thoth.plot.ring.properties |
| Bar or column chart (2-D) | bar2d | thoth.plot.bar2d.properties |
| Stacked-bar or -column chart (2-D) | stackedbar2d | thoth.plot.stackedbar2d.properties |
| Scatter plot | scatter | thoth.plot.scatter.properties |
| Step chart | step | thoth.plot.step.properties |
| Line chart | line | thoth.plot.line.properties |
| Bubble chart | bubble | thoth.plot.bubble.properties |
| Histogram plot (1-D) | hist | thoth.plot.hist.properties |
| 2-D Histogram plot (or density plot) | hist2d | thoth.plot.hist2d.properties |
| Polar chart | polar | thoth.plot.polar.properties |
| Area chart | area | thoth.plot.area.properties |
| Box-and-whisker chart | boxwhisker | thoth.plot.boxwhisker.properties |
| Spider-web chart | spiderweb | thoth.plot.spiderweb.properties |
| Gantt chart | gantt | thoth.plot.gantt.properties |
| 3-D Stacked-bar or -column chart | stackedbar3d | thoth.plot.stackedbar3d.properties |
| 3-D Surface chart | surface3d | thoth.plot.surface3d.properties |
A wide variety of statistics are computed for a given numerical-data table column in
the returned data table from a database query or file import, including "robust"
statistics (i.e., which are stable against the effects of outliers).
The table column of interest can be selected by the user from a pull-down
menu on the statistics panel, which is accessed via the "Statistics"
button on the Main-GUI panel.
- The median is a robust estimator of the data average, and
inherently has an uncertainty that is proportional to the
median of the absolute deviations. For a sample of N values,
the proportionality factor is approximately 1.858/sqrt(N-1),
according to Jorg W. Muller (J. Res. Natl. Inst. Stand. Technol.,
vol. 105, no. 4, July-August 2000, pp. 551-555).
- The statistical quantity "scale" is a robust estimator of the
data-distribution half width, defined as 0.5 * [84 percentile - 16
percentile]. In the special case of a Gaussian distribution,
the scale is equal to the standard deviation.
- Bad data values are excluded from the statistical calculations
made by Thoth. These include NaNs (not a number), Infs (infinity),
null values, blank values, etc.
As a convenience, newly computed and displayed statistics for a single
data column are automatically copied to the system clipboard. Thus, the
statistical results can be quickly pasted into an e-mail or a
text-editor window for saving in a file.
There is a function on the Statistics panel to compute the linear
correlation between two data columns. A pull-down
menu in this section on the Statistics panel is used to select the
second data column of interest for correlation with that of the
computed statistics. This function computes the
Pearson r-value for just the selected first and second columns from the pull-down menus.
There is also a tool on the Statistics panel to compute linear correlations for
all combinations of numerical columns (excluding "rownum" and column names
ending with "id").
This is done via the "Generate Column-Correlation Table" button.
The results are stored separately in a new Thoth
table that is displayed in the Main-GUI panel, which can be
conveniently plotted on a horizontal bar chart (check the
"Invert plot" checkbox so the correlated column names are readable).
The Statistics panel also has a tool for computing a so-called general statistics table, for all
numerical columns in the currently selected Thoth data table, which is done via the
"Generate General Statistics Table" button. Clicking
on this button will cause a statistics table to be computed for all
numerical-data table columns in the currently selected tabbed pane in the Main-GUI panel.
The statistics table is subsequently displayed on the Main-GUI panel
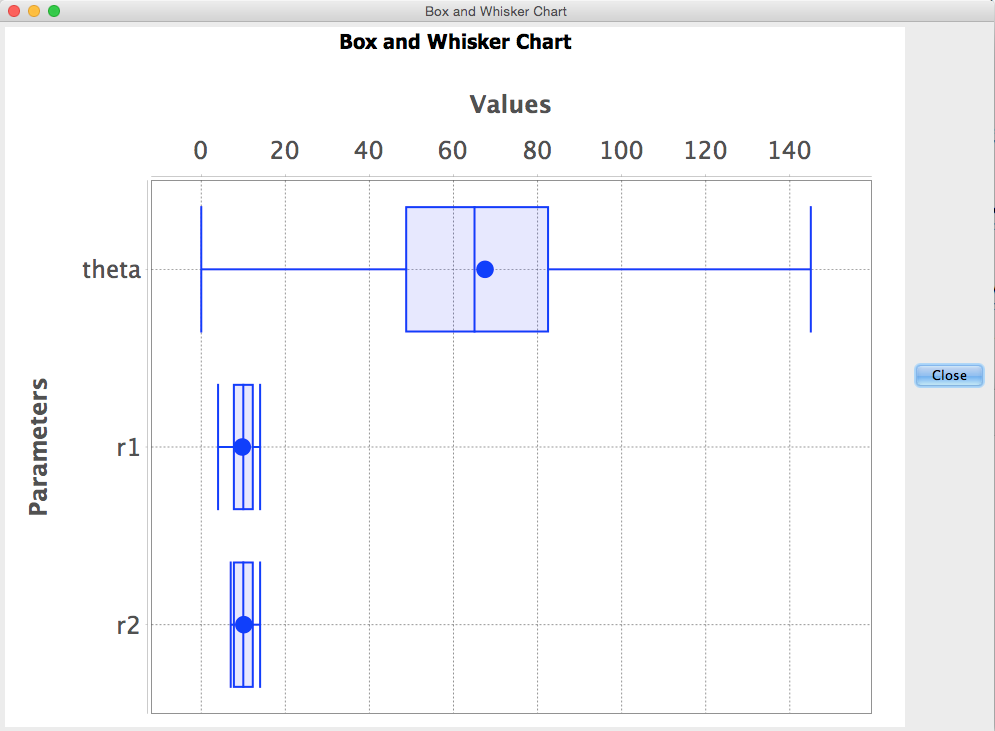
in a new tabbed pane. A box-and-whisker chart can be generated from a
statistics table, as illustrated by the example below, which shows
medians, averages (solid circles), first and third quartiles, and, at the whisker ends,
minimums and maximums.
Example Box and Whisker Chart
 One can also manually construct a table that is suitable for plotting on a
box-and-whisker chart. The short table below is an example. The
first column gives names for the box elements on the chart. The
following column names are required: Average, Median, Percentile25,
Percentile75, Minimum, and Maximum (case-sensitive). Only a handful
of rows in such table can be readily visualized on a box-and-whisker
chart (because the name-width is constrained by the allowed box-width,
unless the plot is inverted so that the whiskers are horizontal).
One can also manually construct a table that is suitable for plotting on a
box-and-whisker chart. The short table below is an example. The
first column gives names for the box elements on the chart. The
following column names are required: Average, Median, Percentile25,
Percentile75, Minimum, and Maximum (case-sensitive). Only a handful
of rows in such table can be readily visualized on a box-and-whisker
chart (because the name-width is constrained by the allowed box-width,
unless the plot is inverted so that the whiskers are horizontal).
Member   Average   Median   Percentile25   Percentile75   Minimum   Maximum
Fred       4.5       4.8      2.5            8.3            0.9       10.3
Ethel      3.7       4.5      1.3            9.5            0.2       11.7
Finally, there is a tool on the Statistics panel for computing a table of
binned statistics. The data column to be binned, which will generally
be different from the data column for which statistics will be computed,
can be selected via a pull-down menu. The other input parameters for
the binned-statistics tool are: bin-start value, bin-end value, bin width, and
lower/upper limits for outlier rejection. Clicking on the
"Generate Binned-Statistics Table" button causes a binned-statistics
table to be computed and subsequently displayed on the Main-GUI panel
in a new tabbed pane.
A box-and-whisker chart can be generated for the binned statistical
quantities versus the bin-center values (as long as the number of bins
are limited to around 10, in order to allow the bins adequate width to be labeled
properly on the domain axis).
A table can be imported from a data file by clicking on the
"Import Table" button. Simple plain-text tables, IPAC tables,
and FITS ASCII and binary tables can be imported. In the case of simple
plain-text tables (IPAC tables excepted), the file format must strictly
conform to the following rules:
- The first line of the imported table must be a header row containing
delimited column names.
- All columns in the table must be delimited by the same
delimiting character in every row, including the header row.
- The user can select from the following choices of delimiting
characters: space, tab, comma, colon, semi-colon, or pipe ("|").
Any white space surrounding the delimiter will be filtered out during
the import process.
Note that querying or importing extremely large tables may be memory
intensive and time consuming,
and may cause memory swapping.
Images from FITS files can also be imported into Thoth as data tables.
This functionality is handy for making image-slice plots through rows
(if the image is transposed) or columns of an image.
The checkbox option of transposing the image is available for taking full
advantage of Thoth's column-wise plotting capabilities. Another option
is to include a row-number column, with special column name "rownum", as the
first column of the table of image data, which facilitates the
generation of scatter plots of image slices, etc.
The text representation of the table includes a listing of the
entire FITS header (for all header-data units therein).
Testing was conducted on images with BITPIX = 8, 16, -32, and -64, and on an image
as large as 3Kx3K pixels with BITPIX = -32, which took a couple
minutes to be read in and displayed as a Thoth table.
In the case of images with BITPIX = 16 (only), if the BSCALE and BZERO
keywords are present, then the associated scale and offset are applied
to the image data.
A table can be exported to a file by clicking on the "Export Table" button.
Various table formats for exporting tables are available.
Thoth has command-line options for non-interactive graphing.
This allows Thoth to be integrated into batch scripts.
Nota bene: The column indexes specified in the graph-settings file
must match the columns in the source data table (which can be
rearranged via the -q option, so beware!).
$ Thoth.csh -h

Thoth, v. 5.7

Usage: Thoth.csh or Thoth.bat [command-line options]

For graphical-user interface: Omit command-line options,
except for -p option.

Command-line options for general use:
 -p Input user-preferences filename
    (Default: ~/.Thoth/thoth.run.properties)
Command-line options for non-interactive batch mode:
 -g Input graph-settings filename
    (Default: ~/.Thoth/plots/pie/thoth.plot.pie.properties)
 -q Input database query
    (Default query is specified in preferences file;
    enclose command-line SQL statement in quotes,
    and do not use * wildcard on command line!)
 -t Output graph type
    (Default is pie)
    Available 2-D graph types:
      pie   (Pie)           web     (Spider Web)
      ring  (Ring)          step    (Step)
      bar2d (2-D Bar)       stbar2d (2-D Stacked Bar)
      scatt (Scatter)       bubb    (Bubble)
      line  (Line)          hist1d  (1-D Histogram)
      gantt (Gantt)         hist2d  (2-D Histogram)
      area  (Area)          boxw    (Box and Whisker)
      polar (Polar)
    Available 3-D graph types:
      stbar3d (3-D Stacked Bar)
      surface3d (3-D Surface)
 -o Output graph PNG filename
    (Default: thothOutputGraph.png)
 -h (Help switch to list available command-line options)
Here are example Thoth commands:
Thoth.csh -p ~/.Thoth/thoth.run.ztf.properties -o ~/thothpiechart.png -g ~/.Thoth/plots/pie/thoth.plot.pie.test.properties -t pie
Thoth.csh -p ~/.Thoth/thoth.run.russ.properties -o ~/thothringchart.png -g ~/.Thoth/plots/ring/thoth.plot.ring.test.properties -t ring
Thoth.csh -p ~/.Thoth/thoth.run.russ.properties -o ~/thothbarchart.png -g ~/.Thoth/plots/bar2d/thoth.plot.bar2d.test.properties -t bar2d
Thoth.csh -p ~/.Thoth/thoth.run.russ.properties -o ~/thothstackedbarchart.png -g ~/.Thoth/plots/stackedbar2d/thoth.plot.stackedbar2d.test.properties -t stbar2d
Thoth.csh -p ~/.Thoth/thoth.run.russ.properties -o ~/thothscatterplot.png -g ~/.Thoth/plots/scatter/thoth.plot.scatter.test.properties -t scatt
Thoth.csh -p ~/.Thoth/thoth.run.russ.properties -o ~/thothstepplot.png -g ~/.Thoth/plots/step/thoth.plot.step.test.properties -t step
Thoth.csh -p ~/.Thoth/thoth.run.russ.properties -o ~/thothlineplot.png -g ~/.Thoth/plots/line/thoth.plot.line.test.properties -t line
Thoth.csh -p ~/.Thoth/thoth.run.russ.properties -o ~/thothbubbleplot.png -g ~/.Thoth/plots/bubble/thoth.plot.bubble.test.properties -t bubb
Thoth.csh -p ~/.Thoth/thoth.run.russ.properties -o ~/thothganttplot.png -g ~/.Thoth/plots/gantt/thoth.plot.gantt.test.properties -t gantt
Thoth.csh -p ~/.Thoth/thoth.run.russ.properties -o ~/thothhistplot.png -g ~/.Thoth/plots/hist/thoth.plot.hist.test.properties -t hist1d -q "select B_V, Mv from thoth1"
Thoth.csh -p ~/.Thoth/thoth.run.russ.properties -o ~/thothhist2dplot.png -g ~/.Thoth/plots/hist2d/thoth.plot.hist2d.monika2.properties -t hist2d -q "select B_V,Mv from thoth1"
Thoth.csh -p ~/.Thoth/thoth.run.russ.properties -o ~/thothhist2dplot.png -g ~/.Thoth/plots/hist2d/thoth.plot.hist2d.monika2.properties -q "select B_V,Mv from thoth1" -t hist2d
Thoth.csh -p ~/.Thoth/thoth.run.russ.properties -o ~/thothhist2dplot.png -g ~/.Thoth/plots/hist2d/thoth.plot.hist2d.monika2.properties -t hist2d -q 'select B_V, Mv from thoth1'
Thoth.csh -p ~/.Thoth/thoth.run.russ.properties -o ~/thothhist2dplot.png -g ~/.Thoth/plots/hist2d/thoth.plot.hist2d.monika2.properties -q 'select B_V, Mv from thoth1' -t hist2d
Thoth.csh -p ~/.Thoth/thoth.run.russ.properties -o ~/thothpolarplot.png -g ~/.Thoth/plots/polar/thoth.plot.polar.test.properties -t polar
Thoth.csh -p ~/.Thoth/thoth.run.russ.properties -o ~/thothareaplot.png -g ~/.Thoth/plots/area/thoth.plot.area.test.properties -t area
Thoth.csh -p ~/.Thoth/thoth.run.russ.properties -o ~/thothboxwhiskerplot.png -g ~/.Thoth/plots/boxwhisker/thoth.plot.boxwhisker.test.properties -t boxw \
          -q "select DataColumn,Average,Median,Percentile25,Percentile75,Minimum,Maximum from thoth2"
Thoth.csh -p ~/.Thoth/thoth.run.russ.properties -o ~/thothspiderwebplot.png -g ~/.Thoth/plots/spiderweb/thoth.plot.spiderweb.test.properties -t web \
          -q "select name,legs,eyes from thoth2"
Thoth.csh -p ~/.Thoth/thoth.run.russ.properties -o ~/thothstackedbar3dplot.png -g ~/.Thoth/plots/stackedbar3d/thoth.plot.stackedbar3d.test.properties -t stbar3d \
          -q "select gender,class,survivors,victims from thoth3"
Thoth.csh -p ~/.Thoth/thoth.run.russ.properties -o ~/thothsurface3dplot.png -g ~/.Thoth/plots/surface3d/thoth.plot.surface3d.test.properties -t surface3d \
          -q "select colnum14,colnum15,colnum16,colnum17,colnum18 from thoth1 where rownum ≥ 14 and rownum ≤ 23 order by rownum"
The examples above that omit the optional -q option fall back on the
default query in the user-preferences file specified by the -p option.
Thoth can potentially connect to any database that supports Java
Database Connectivity (JDBC). This software package currently includes
JDBC drivers for the database types listed below.
| Database type | Driver name | Jar filename |
|---|
|
PostgreSQL
|
org.postgresql.Driver
|
postgresql-8.4-701.jdbc4.jar
|
|
MySQL
|
com.mysql.jdbc.Driver
|
mysql-connector-java-5.1.26-bin.jar
|
|
HyperSQL
|
org.hsqldb.jdbc.JDBCDriver
|
hsqldb.jar
|
|
SQLite
|
org.sqlite.JDBC
|
sqlite-jdbc-3.7.15-M1.jar
|
Database drivers for commercial databases, such as Oracle and
Informix, are not included in the Thoth package to avoid
software-licensing infringement. Nevertheless Thoth can be made to
work with commercial databases that have a JDBC driver. For any
JDBC-supported database not listed above, the CLASSPATH environment
variable should be defined with a path to the jar file of the
corresponding JDBC driver.
Thoth has been specially augmented with an Awesome Kepler Movie Player! This
automatically pops up when Kepler or K2 FITS files are imported via
the following options:
Import Table > FITS Table File (ASCII or Binary)
The movie player includes controls to play/stop/rewind a movie,
and to single-frame step forward or backward.
There are also controls for setting the image stretch, and plotting
image histograms. The mouse cursor can be used to pick off image-pixel
coordinates and values. The movie player is really useful for discovery
of asteroids moving through image frames.
In the table display, the Kepler or K2 data columns that
contain postage-stamp images are replaced with integrated
values of image sum - count * median. These include the
RAW_CNTS, FLUX, FLUX_ERR, FLUX_BKG, FLUX_BKG_ERR,
and COSMIC_RAYS columns.
- Coding needed to allow subscripts and superscripts in axis titles.
- When importing tables, add functionality for the user to select which column(s) to import.
- Filter rows for selected attributes (include boolean operations).
- Multiple data series for box-and-whisker charts.
- See whether graph-label functionality can be easily added to Gantt charts.
The maximum number of columns allowed for a SQLite database is 2000 (by
default, SQLITE_MAX_COLUMN = 2000).
If a table is queried or imported into Thoth having more columns than
this limit, an exception would normally be raised when the software creates the associated
table in the SQLite scratch database (called "thoth.db" in the
invisible ".Thoth" directory in the user's home directory). This
exception is averted by forcing the software to create a SQLite
scratch table that is limited to 2000 columns.
Otherwise, there is no restriction on the number of rows or columns in a data
table (except for computer memory limitations). All columns of a table with more
than 2000 columns will be loaded into a Thoth table model, so that
statistics can be computed on any of its columns; however, as
mentioned above, a table with only the first 2000
columns will be created in the SQLite scratch
database.
Thoth tables with 5000 rows or less are no longer automatically
copied to the system clipboard. A Thoth table can be
manually put on the system clipboard via the Clipboard Table button on
the Main-GUI panel.
Only tables with less than 8000 rows can be printed. This limits the
print job to 100 pages (50 double-sided pages).
v. 5.9 (5/11/23)
Added EXTNAME labels the pull-down menu showing the HDUs available for
selection to display the corresponding image.
Modified the FITS viewer to print out real-time cursor values with
more precision (at least all digits to the left of the decimal point
for values below 1.0e9).
Fixed column-name-selection bugs in the functionality for making a
binned-statistics table.
Added dialog message to inform user that one can create a
box-and-whisker chart from a Thoth-generated binned-statistics table (just as can be
done from a Thoth-generated general statistics table), as it contains all
of the required columms.
Modified the panel for the box-and-whisker chart with a combo box to allow selection of
the table column to use for the x-axis labels, for cases where the statistics table has an added
custom label column that is not necessarily the first column (also,
the special "rownum" column is a possible choice, if enabled under preferences).
Here is an example SQLite database query to add a custom label column:
select *,'x' || rowid as mylabels from thoth2 order by bincenter;
Augmented the data-source message for the
binned-statistics table, which is displayed in the text area for queries after
the query has been submitted, in order to explicitly identify of the data columns
involved (that is, for which column the statistics are computed, and
on which column the binning is done).
Replaced the cubehelix color table of 20 swatches in
ColorScale.getCubehelixColorScaleForColorTablePanel()
with more accurate colors computed from the formula.
This matters when matching colors by eye between the displayed image
and the color-table legend with data-level ranges shown as tool tips.
v. 5.8 (6/29/22)
When importing an image from a FITS file into a Thoth table,
added new functionality to optionally collapse the image data into a single column.
Did some code restructuring to make the FITS-image viewer work better.
Added a new function to the Statistics panel to compute the linear
correlation between two data columns. This function computes the
Pearson r-value for just the selected first and second columns from the pull-down menus.
Added a new tool to the Statistics panel to compute linear correlations for
all combinations of numerical columns (excluding "rownum" and column names
ending with "id").
This is done via the "Generate Column-Correlation Table" button.
The results are stored separately in a new Thoth
table that is displayed in the Main-GUI panel, which can be
conveniently plotted on a horizontal bar chart (check the
"Invert plot" checkbox so the correlated column names are readable).
Added wait-cursor to actions both on the Main-GUI panel and on the
Statistics panel, in order to indicate to the user that the
software is busy when large tables are being processed.
Completely reorganized the layout of controls on the Statistics panel
to have a better work-flow.
Improved the software documentation accessible via the About & Help button.
v. 5.7 (3/31/22)
Fixed code that sets resourcesDir in the ThothPanel class, which
was preventing deleteButton.gif from being displayed as a table-delete icon on the
Thoth-table buttons in Thoth, v. 5.6.
Bug fix: Added new code to prevent deletion of the Thoth scratch database
prior to actions involving the generation of a Thoth binned-statistics
table.
Upgraded the build.xml file to robustly ensure that the
background image "Drag to Application Folder" is displayed
in the opened folder after clicking on the Thoth.dmg package file.
Modified the control-panel class of the area chart to disable the
resetting of the relevant axis title and extrema to defaults
after switching data-series tabbed panes, because this had been
stomping on any prior manual customizations.
Ditto for these other charts: web, scatter, step, bubble, line, 1-D
histogram, 2-D bar, 2-D stacked bar, and 3-D stacked bar.
Modified the control-panel classes of all 17 graphs to allow the
arbitrary adjustment of the plot-title font size (along with the plot
subtitle in the case of the spider-web chart, 3-D stacked bar chart,
and 3-D surface chart).
Modified the PlotSelection class for the box-and-whisker chart to
convert the column headings to lower case before testing for the
required names, which allows SQL-query manipulation of the
Thoth-generated statistics table in case rows need to be subsequently
eliminated from that table for the box-and-whisker chart.
Increased the font size of the color-scale legend to 18 pts on 3-D surface charts.
v. 5.6 (1/11/22)
Fixed bug that prevents reading IPAC-table files with no data-units header line
when option Add Row-Number Column is activated under Preferences.
v. 5.5 (1/10/22)
ATTENTION: This version of Thoth now requires Java 1.8 or higher to run properly.
Built the Thoth.jar file on a MacBook Pro laptop under macOS Catalina, Version 10.15.7
using apache-ant-1.9.16 and JDK 1.8.0_31. The Thoth.jar file is platform-independent,
of course, and can be run on any computer with available Java 1.8 or
higher, such as Windows, Macs, Linux, etc.
Completely revamped the bundling of the clickable app for the Mac so
that there are no longer dependencies on JavaApplicationStub
and no longer explicit dependencies on com.apple.eawt.* Java classes.
The Mac clickable app utilizes Java option -Xmx8192m for the memory
setting, and users with different memory requirements will have to run
Thoth from the command line with explicit java command (see listing of
Thoth.csh for examples).
Added code to FitsImagePanel class to catch the following exception:
Exception in thread "AWT-EventQueue-0" java.lang.InternalError: Surface not cachable.
New capability of interactive 3-D surface charts implemented,
which displays a 3D surface chart of the Thoth table data (omitting
the "rownum" column), where the surface is computed via bilinear interpolation.
In the preferences (save preferences after running the new tool interactively),
the keywords imageSurfaceChart3DGridAxisSamplesX and imageSurfaceChart3DGridAxisSamplesY
control the number of samples in the interpolation grid along each dimension,
and the default value is 70. The 3D surface chart can be
rotated interactively by dragging with the mouse to view the
surface chart from any angle.
Setting a higher number of interpolation-grid samples will make the
rotation response slower. ALT-mouse-drag can be used to move the
3D surface chart within the display panel, and the mouse wheel zooms in and out.
Thanks to the Orson Charts library (http://www.object-refinery.com/orsoncharts).
Added -t surface3d graph-type option to ThothGraph class.
Fixed bug in ConnectionsPanel class to enable the Add button when the
New tab is displayed when transitioning from the Thoth tab.
Added new capability of running Thoth from the command line in a
terminal window with only the option -p Input user-preferences filename,
in order to run the GUI with a user-selected preferences file that is
not the default ~/.Thoth/thoth.run.properties file.
Upgraded the SQLite jar file to sqlite-jdbc-3.36.0.3.jar. This
version allows the maximum number of columns in a SQLite-database
table to be 2000.
Thoth tables with 5000 rows or less are no longer automatically
copied to the system clipboard. A Thoth table can be
manually put on the system clipboard via the Clipboard Table button on
the Main-GUI panel.
v. 5.4 (4/14/20)
Fixed display bug that arises during the importation of an IPAC table when the
option is enabled for augmenting the table with the extra row-number
column (with special column name "rownum").
v. 5.3 (3/29/20)
Added logic to the TableModelBuilder class
for case where a table column contains all NULL
values, in which case the column type defaults
to Types.VARCHAR.
Increased the Java memory allocation in APT.csh and APT.bat from 4096M to 8192M.
Also, specified VMOptions -Xms48M -Xmx8192M in Info.plist file for
Mac double-click Thoth launcher.
Attempted to fix bug "java.lang.InternalError: Surface not cachable" that emerges
with some java versions (1.8+) on some platforms [e.g., CentOS Linux 7
(Core) 3.10.0-693.17.1.el7.x86_64] when the FITS-image viewer
is run, but was unsuccessful.
Fixed bugs that were preventing the FITS-image viewer from displaying
when certain display parameters are missing from thoth.run.properties
(found during Windows testing).
Modified script Thoth.nsi to skip check of JRE version; the Windows double-click Thoth launcher,
Thoth.exe (which is included with Thoth_vX.Y.zip), is generated by compiling
this script. Also, increased the Java memory allocation in Thoth.nsi
(and therefore Thoth.exe) from 1024M to 4096M.
v. 5.2 (12/10/18)
Fixed bug in FITS-image importer to
adhere to the convention that
byte images have data that are unsigned integers by default.
Modified the WCS class to apply the PC matrix in fixing a
CDELT1 sign error, which is needed for Pan-STARRS images.
Thanks to Richard Nowell (Bristol U.K.) for pointing out this problem.
v. 5.1 (12/4/18)
Added triangle and arrow to the list of
available shapes for graph markareas.
Added a rotation parameter for 2-D markareas.
Modified Thoth's Main-GUI panel to display
a moving progress bar when the FITS-image viewer
is loading image data from a file.
Augmented the "Connections" panel with functionality
to update database-connection parameters (except for the
Thoth scratch database). The user must save preferences to persist
any changes permanently.
Modified the "Graph Labels" panel to paint the "Update Labels"-button
text red when any graph-label parameter has been changed by the user,
in order to highlight the need for updating the plot with the changes
(but changes are not persisted unless the user saves graph settings).
Now, the user can update all label changes by clicking on the
"Update Labels" button once rather than having to update each label individually.
Modified the "Graph Marklines" panel to paint the "Update Marklines"-button text red
when any graph-markline parameter has been changed by the user,
in order to highlight the need for updating the plot with the changes
(but changes are not persisted unless the user saves graph settings).
Now, the user can update all markline changes by clicking on the
"Update Marklines" button once rather than having to update each markline individually.
Modified the "Graph Markareas" panel to paint the "Update Markareas"-button text red
when any graph-markarea parameter has been changed by the user,
in order to highlight the need for updating the plot with the changes
(but changes are not persisted unless the user saves graph settings).
Now, the user can update all markarea changes by clicking on the
"Update Markareas" button once rather than having to update each markarea individually.
Fixed bugs in the TableImporter and ResultTextTable classes that make
reading in IPAC tables and displaying them in Thoth's main panel more robust.
Set the default directory for saving graphs as PNG
files to the working directory, which is persisted by the property "workingDir"
in the user-preferences file (~/.Thoth/thoth.run.properties).
Moved the filename-chooser code from the TableImporter class
to the TableImporterPanel class.
Modified the FITS-image viewer to
load compressed FITS-image files, which
necessitates a new dependency on commons-compress-1.18.jar.
Upgraded dependent nom.tam.fits package to version 1.15.1
as part of this work.
v. 5.0 (10/2/18)
Upgraded the basic FITS-image viewer
to compute (R.A., Dec.) sky coordinates
if a world coordinate system (WCS) is
available in the FITS header.
Added new menu-bar category "Image", and, under it,
added new menu item "View FITS Image", which allows
a FITS image to be chosen and viewed directly, as a
convenience, i.e., without having to load the image
into a Thoth table.
Added buttons and associated functionality
to the FITS-image viewer for setting the blank-pixel and
saturated-pixel display colors, and also the data level
above which saturated pixels are accordingly marked.
Augmented the FITS-image viewer with a button
to display the associated FITS-header listing.
Modified the FITS-image viewer so that changes in
image magnification keep the currently shown image
center at the center of the image-viewing window.
Fixed bugs in the FITS-image reader, viewer, and table loader. Also,
made changes to make them more robust, and reworked them, which
involved a substantial amount of code reorganization (and a new
class called FitsImageReader).
Reorganized the existing Thoth preferences panel under tabbed panes
(titled "Table" and "Database"). Added a tabbed pane for "FITS-Image
Viewer" and under it new options for setting a flag to use scientific
notation for displaying pertinent numbers on the FITS-image viewer,
and also an option for setting the celestial-coordinates
representation (decimal or sexagesimal).
v. 4.9 (9/12/18)
Added new menu-bar category "Database", and
added new menu item "Save Scratch Database"
under it, along with the associated new functionality.
Added control-s functionality to the "Save Scratch Database" menu item for non-Mac
machines, and similar command-s functionality for Macs.
Modified the code to create any nonexistent
subdirectories when saving graph settings
in the default location
~/.Thoth/plots/graphType.
Bug fix: Removed terminating semicolon from default
query in function makeStatisticsTable, in order to
prevent exception raised by SQL prefiltering, if enabled.
Modified code to skip the "rownum" column, if present in a data table,
when generating a general statistics table.
Added new capability of a basic FITS-image viewer,
which can be accessed when loading a FITS image into a table.
v. 4.8 (8/1/18)
Modified the software to save the slice colors in
the graph-settings file for pie and ring charts.
Bug fix: Modified the 1-D histogram-plotting software
to use the histogram-bin colors with the color opacity that the user
selected (it was displaying fully opaque colors before).
Fixed a bug in the GraphLabelsPanel class that prevented
updating the category associated with the domain-axis position of
a label (pertains to plots with categories, like bar charts).
Also fixed a category-initialization bug.
Added new capability of exporting FITS-image files.
Modified the software to apply BZERO and BSCALE
when a short-integer FITS-image file with those keywords
is loaded as a data table into Thoth.
Added new capability of scaling the sizes of bubbles
on bubble charts, from 0 to 300% of the user-selected table column
that defines the baseline bubble sizes for a given data series.
v. 4.7 (7/2/18)
Modified the software to remake the text-based table for display
on Thoth's Main-GUI panel when a table cell value in the spreadsheet
representation is changed by the user.
Modified the code to read and display the
optional data-units line of IPAC tables in the text mode.
This is in addition to the previous similar upgrade to
handle the data-type line of IPAC tables.
Modified the software to automatically format the
displayed values on section labels of pie and ring charts
(i.e., integer versus floating-point numbers).
Implemented a new tool on the Statistics panel to compute a table of
binned statistics.
Fixed a truncated-end-character bug in the code that parses columns
from data lines read in from an imported IPAC table.
Added a new capability under the menu revealed by the "Import Table" button
that enables the loading of a FITS-image file as a data table into Thoth.
This functionality is handy for making image-slice plots through rows
(if the image is transposed) or columns of an image.
The checkbox option of transposing the image is available for taking full
advantage of Thoth's column-wise plotting capabilities. Another option
is to include a column of row numbers, with special column name "rownum", as the
first column of the table, which is useful for scatter plots, etc.
The text representation of the table includes a listing of the
entire FITS header (for all header-data units therein).
Tested this on images with BITPIX = 16, -32, and -64, and on an image
as large as 3Kx3K pixels with BITPIX = -32, which took a couple
minutes to be read in and displayed as a Thoth table. A 9Kx9K image
with BITPIX = -64 was also attempted, and it took ~12 minutes for the
same; images of this size are quite impractical to work with in Thoth,
because everything will take so much longer, but making a scatter plot
from it, for example, can be done eventually if the user is exceedingly patient
(and if Java does not run out memory).
Keep in mind that only the first 999 columns will be loaded into the
corresponding SQLite table newly created in the scratch database.
The user is responsible for ensuring that adequate machine memory is
available and the allocated Java heap size is sufficient.
v. 4.6 (5/17/18)
Modified the -t command-line option to accept a short string
describing the graph type, rather than an integer index,
in order to allow rearrangement of the list when adding new
graph types in the future:
$ Thoth.csh -h

Thoth, v. 4.6

Usage: Thoth.csh or Thoth.bat [command-line options]

For graphical-user interface: Omit command-line options.
Here are the options for non-interactive batch mode:
 -p Input user-preferences filename
    (Default: ~/.Thoth/thoth.run.properties)
 -g Input graph-settings filename
    (Default: ~/.Thoth/plots/pie/thoth.plot.pie.properties)
 -q Input database query
    (Default query is specified in preferences file;
     enclose command-line SQL statement in quotes,
     and do not use * wildcard on command line!)
 -t Output graph type
    (Default is pie)
    Available graph types:
      pie   (Pie)               web     (Spider Web)
      ring  (Ring)              stbar2d (2-D Stacked Bar)
      bar2d (2-D Bar)           stbar3d (3-D Stacked Bar)
      scatt (Scatter)           bubb    (Bubble)
      line  (Line)              hist1d  (1-D Histogram)
      gantt (Gantt)             hist2d  (2-D Histogram)
      area  (Area)              boxw    (Box and Whisker)
      polar (Polar)             step    (Step)
 -o Output graph PNG filename
    (Default: thothOutputGraph.png)
 -h (Help switch to list available command-line options)
Added code to skip comment lines, blank lines, and configuration-parameter-setting lines
when importing a table from Postgres load file. Tested this
sofware change on a 4.8-M row table dumped from a Postgres database.
Modified code to explicitly disallow table-column reordering in the table-cell view.
Modified code to allow table values to be edited in the table-cell
view, via the following method: 1) double-clicking on the cell to be edited;
2) changing the value; and 3) hitting the return key or clicking on a different cell.
Started experimenting with new Apache Poi classes
for manipulating table values in Excel files.
Added new capability of creating a custom table of arbitrary size with
different arbitrary first-row initial values across table columns (string, integer, or
floating-point default values, depending on desired column type), and
computations for other rows specified by Excel formulas.
Created new TableModelBuilder class, for reuse by both TableImporter
and CustomTablePanel classes.
Developed new BinnedStatistics class. In later Thoth versions, there
will be capabilities for generating binned-statistics tables.
Added text fields to the 2-D histogram control panel
for specifying the z-axis minimum and maximum, which
sets the color-scale range, and color-scale font size.
Added these new parameters to the list of graph settings
that can be saved for a particular graph instance.
Rearranged the 2-D histogram control panel to have X- and
Y-axis parameters on top of the control panel, since the domain of
the X and Y data determine the default minimum and maximum Z-range values.
v. 4.5 (3/20/18)
Added code to trim leading and trailing spaces from table lines when
importing space-delimited plain-text tables. Also, added code to skip
the non-standard marker lines in the output photometry table generated
by Aperture Photometry Tool (APT) from www.aperturephotometry.org, which
is otherwise a space-delimited plain-text table.
Fixed opacity bug in the classes that generate area charts and bubble charts.
Modified the SqliteTableWriter class to avoid SQLite-database
table-column names that are SQLite reserved keywords by appending
the string "rsvd" to such column names.
Modified the SqliteTableWriter class to
always create an index on the "rownum" column
if it exists in the SQLite database table being created.
v. 4.4 (1/8/18)
Added new code to import and export PostgreSQL query files
(i.e., a plain-text data format that is similar to output
from a database query executed via the psql command, which
has pipe-delimited data columns).
Added the capability of inverting the range axis
on 2-D bar and stacked-bar charts,
area charts, and line charts.
Modified code to allow blanks in the data columns
of delimited plain-text data-table files and IPAC-table files.
Added attribute of color opacity to data marklines.
Upgraded 2-D bar and stacked-bar charts,
area charts, and line charts with the capability
of overlaying arbitrary data marklines.
Bug fix: 3-D stacked-bar chart was not displaying because of
misconfigured default view parameters.
Added example step chart to documentation.
v. 4.3 (12/5/17)
Added new capability of generating spider-web charts.
Added new capability of generating ring charts.
Added command-line options to Thoth for non-interactive graphing.
This allows Thoth to be integrated into batch scripts.
Tested the following cases.
Nota bene: The column indexes specified in the graph-settings file
must match the columns in the source data table (which can be
rearranged via the -q option, so beware!).
Thoth.csh -p ~/.Thoth/thoth.run.ztf.properties -o ~/thothpiechart.png -g ~/.Thoth/plots/pie/thoth.plot.pie.test.properties -t 1
Thoth.csh -p ~/.Thoth/thoth.run.russ.properties -o ~/thothringchart.png -g ~/.Thoth/plots/ring/thoth.plot.ring.test.properties -t 2
Thoth.csh -p ~/.Thoth/thoth.run.russ.properties -o ~/thothbarchart.png -g ~/.Thoth/plots/bar2d/thoth.plot.bar2d.test.properties -t 3
Thoth.csh -p ~/.Thoth/thoth.run.russ.properties -o ~/thothstackedbarchart.png -g ~/.Thoth/plots/stackedbar2d/thoth.plot.stackedbar2d.test.properties -t 4
Thoth.csh -p ~/.Thoth/thoth.run.russ.properties -o ~/thothscatterplot.png -g ~/.Thoth/plots/scatter/thoth.plot.scatter.test.properties -t 5
Thoth.csh -p ~/.Thoth/thoth.run.russ.properties -o ~/thothstepplot.png -g ~/.Thoth/plots/step/thoth.plot.step.test.properties -t 6
Thoth.csh -p ~/.Thoth/thoth.run.russ.properties -o ~/thothlineplot.png -g ~/.Thoth/plots/line/thoth.plot.line.test.properties -t 7
Thoth.csh -p ~/.Thoth/thoth.run.russ.properties -o ~/thothbubbleplot.png -g ~/.Thoth/plots/bubble/thoth.plot.bubble.test.properties -t 8
Thoth.csh -p ~/.Thoth/thoth.run.russ.properties -o ~/thothganttplot.png -g ~/.Thoth/plots/gantt/thoth.plot.gantt.test.properties -t 9
Thoth.csh -p ~/.Thoth/thoth.run.russ.properties -o ~/thothhistplot.png -g ~/.Thoth/plots/hist/thoth.plot.hist.test.properties -t 10 -q "select B_V, Mv from thoth1"
Thoth.csh -p ~/.Thoth/thoth.run.russ.properties -o ~/thothhist2dplot.png -g ~/.Thoth/plots/hist2d/thoth.plot.hist2d.monika2.properties -t 11 -q "select B_V,Mv from thoth1"
Thoth.csh -p ~/.Thoth/thoth.run.russ.properties -o ~/thothhist2dplot.png -g ~/.Thoth/plots/hist2d/thoth.plot.hist2d.monika2.properties -q "select B_V,Mv from thoth1" -t 11
Thoth.csh -p ~/.Thoth/thoth.run.russ.properties -o ~/thothhist2dplot.png -g ~/.Thoth/plots/hist2d/thoth.plot.hist2d.monika2.properties -t 11 -q 'select B_V, Mv from thoth1'
Thoth.csh -p ~/.Thoth/thoth.run.russ.properties -o ~/thothhist2dplot.png -g ~/.Thoth/plots/hist2d/thoth.plot.hist2d.monika2.properties -q 'select B_V, Mv from thoth1' -t 11
Thoth.csh -p ~/.Thoth/thoth.run.russ.properties -o ~/thothpolarplot.png -g ~/.Thoth/plots/polar/thoth.plot.polar.test.properties -t 12
Thoth.csh -p ~/.Thoth/thoth.run.russ.properties -o ~/thothareaplot.png -g ~/.Thoth/plots/area/thoth.plot.area.test.properties -t 13
Thoth.csh -p ~/.Thoth/thoth.run.russ.properties -o ~/thothboxwhiskerplot.png -g ~/.Thoth/plots/boxwhisker/thoth.plot.boxwhisker.test.properties -t 14 \
          -q "select DataColumn,Average,Median,Percentile25,Percentile75,Minimum,Maximum from thoth2"
Thoth.csh -p ~/.Thoth/thoth.run.russ.properties -o ~/thothspiderwebplot.png -g ~/.Thoth/plots/spiderweb/thoth.plot.spiderweb.test.properties -t 15 \
          -q "select name,legs,eyes from thoth2"
Thoth.csh -p ~/.Thoth/thoth.run.russ.properties -o ~/thothstackedbar3dplot.png -g ~/.Thoth/plots/stackedbar3d/thoth.plot.stackedbar3d.test.properties -t 16 \
          -q "select gender,class,survivors,victims from thoth3"
For pie charts, replaced the text field for specifying the amount pie slices are to
be exploded with a slider widget.
Made modifications to load via mouse click the current viewpoint
coordinates of the 3-D stacked-bar chart into its
control panel, so that these can be saved in a
graph-settings file.
Completed unfinished coding for saving/loading graph settings
associated with error bars in scatter plots. Previously, only the case of no error
bars was properly saved/loaded.
Added functionality to Gantt-chart control panel that better
differentiates between date/time and name data columns for more
intelligent default graph settings.
Added category pull-down menu on graph-labels panel for
bar charts, stacked-bar charts, line charts, and area charts.
Fixed bug that prevented the bubble size
from being properly saved in the
graph settings for bubble charts.
Fixed start-up bug, which handles the case
for when no database connections are set up or valid
and the scratch database is non-existent.
Replaced a lot of redundant code with calls to
static functions in new ColorPalette class.
Updated the documentation.
v. 4.2 (10/9/17)
Fixed a bug associated with making plots subdirectories
in the ~/.Thoth hidden directory.
Fixed a bug associated with selecting
radio buttons on the graph-labels panel
that are consistent with the loaded graph settings.
Upgraded the software to have the new capability of overlaying arbitrary data "markareas"
on the 1-D histogram plot, 2-D histogram plot (or density plot), scatter
plot, step chart, and bubble chart. A markarea is a line segment, rectangle, or
ellipse that is drawn on the graph as an annotation to highlight a portion of the data.
This is set up via the "Graph Markareas"
button on the control panel for the plot.
v. 4.1 (9/28/17)
Swapped the positions of the "Submit Query" and "Clear Query"
buttons to improve the workflow.
Added code to save/load current graph settings for all the graph types.
For example, for the 2-D histogram plot, the graph settings are
saved to and loaded from a property file in the
"plots/hist2d" subdirectory of the hidden directory, of which the
property filename is required to be of the following form:
"thoth.plot.hist2d.*.properties"
(where * is a user-selectable mnemonic word to associate the
graph settings with a task, project, etc.),
or "thoth.plot.hist2d.properties", the
default property filename for 2-D histogram plots.
Similar namespace allocations for all the graph types have
been designated, and are listed in the above documentation.
v. 4.0 (3/9/17)
Implemented a new option to automatically add a column
for a row index or counter to an imported table
with special column name "rownum", which
is useful to have in some situations (e.g., plotting some
value vs. trial number). This option can be enabled/disabled
via the Preferences menu.
Abstracted some code to hide complexity
(moved Kepler movie-player parameters
from the main class to the appropriate
lower-level class).
Bug fix: Forgot to comment out some experimental code
for 3-D Surface Charts.
Bug fix: Fixed the broken toggling of the
SQL-query prefiltering via the Preferences menu
(this bug was introduced in a previous version when a typo in the
name of an overriden function was incompletely removed).
v. 3.9 (2/21/17)
Added new capability of generating 2-D stacked bar charts
(as opposed to the existing capability of 2-D bar charts
that are unstacked).
New capability of interactive 3-D stacked bar charts implemented.
This is my first successful foray with the Orson Charts library
(http://www.object-refinery.com/orsoncharts)!
Increased the legend font size to 18 pts on pie charts,
2-D bar charts, scatter plots, line charts, step charts,
bubble charts, area charts, polar charts,
and 1-D histogram charts, for better readibility,
especially when preparing data charts
for publication in journals and books.
Modified the code to read and display the
data-type line of IPAC tables in the text mode
(but not in the table-cell mode); this upgrade
makes Thoth more useful for debugging wide IPAC tables.
Fixed a bug that was causing the legend
for multiple data series to disappear
off step charts.
Added the cubehelix color table as an option for
2-D histogram charts.
Added a Yes/No dialog box that pops up
when removing a Thoth# table from the Main-GUI panel.
Improved the code that supports creation of statistics tables.
(Certain unwanted "features" have been eliminated.)
Upgraded the SQLite jar file to sqlite-jdbc-3.16.1.jar.
Improved the built-in documentation, and added to it
more chart examples.
Bug fix: Added logic to test for negative array indices in
function Histogram2DPlot.computeHistogram2D. This is
needed when making a 2-D histogram plot with restricted x or y
domains.
v. 3.8 (10/24/16)
Solved the problem of previous inability to completely
disable the drawing of error bars for individual
data series on scatter plots, by implementing a
custom version of JFreeChart's XYErrorRenderer class
(based on a thread by mrsouthern on jfree.org's phpBB).
Added more options for placing error bars on scatter plots,
both in X and Y.
Upgraded FITS table importer to load the last FITS extension
in a file that is not an image extension; this change allows
LDAC FITS binary tables to be loaded.
Modified the FITS table importer to handle columns
with the byte data type.
v. 3.7 (9/21/16)
Added code to trim leading and trailing spaces from text-field inputs
to the database-connection manager.
Modified code to print database-connection moniker on Main-GUI panel
just before the database URL.
Added "New Connection" button to the database-connection manager,
which is a shortcut to the existing "New" tabbed pane with editable connection form.
The form fields are cleared when the "New Connection" button is
clicked, unlike the aforementioned "New" tabbed pane.
Added code to automatically put newly computed and displayed
data-column statistics on the system clipboard.
Upgraded with the new capability of overlaying arbitrarily placed labels
on scatter plots, histograms (1-D & 2-D), line charts, bar charts,
step charts, and bubble charts. This is set up via the "Graph Labels"
button on the control panel for a particular plot.
Added options to show domain and range grid lines on Gantt charts.
Added logic to automatically pick the correct date/time format for start
and end columns in tabular data to be plotted as a Gantt chart.
Replaced the "Change Database" button with a more convenient
pull-down menu.
Improved the GUI's response when changing tabbed panes from
one table to another, via by-passing the creation of a
ResultTextObject for tables with more than 5000 rows,
which is unnecessary because such a large table is
not automatically placed on the system clipboard.
Deferred the setting of table text in a ResultTextObject
for tables larger than 999,999 rows until
the "Text" tabbed pane is selected, in order to
prevent unrequested work and keep the GUI responsive.
Upgraded with the new capability of putting arbitrary data marklines
on scatter plots, histograms (1-D & 2-D), bubble charts,
and step charts. A markline is a horizontal or vertical line
which extends across the entire range or domain of the plot, respectively.
This is set up via the "Graph Marklines"
button on the control panel for a particular plot.
Added new capability of generating area charts.
Modified the parser of plain-text files to
skip lines that begin with comment-character #
in the first column.
Made minor cosmetic improvements to various control panels.
Did some restructuring to improve the code base.
v. 3.6 (5/27/16)
Added optional SQL-query prefiltering to prevent SQL-injection vulnerabilities.
The default is prefiltering enabled, but it can be disabled via the
Preferences menu.
v. 3.5 (5/12/16)
Added new capability of generating box-and-whisker charts from statistic tables.
Added examples of a polar chart and a box-and-whisker chart to the documentation.
v. 3.4 (3/31/16)
Added options to show grid lines on 1-D histograms, scatter plots, and bar charts.
Added option to set the range-axis decimal-number format on bar charts.
Added optional displaying of slice labels on pie charts.
Replaced the "Lines connect points?" checkbox with a
pull-down-menu option to specify solid, dashed, dotted, or no lines
connecting data points on scatter plots.
Augmented the 1-D histogramming and bar-charting capability
with an option to outline the bars with a thin black line.
Added new capability of generating line charts,
which are like scatter plots, but allow
text labels on the domain-axis categories,
with uniform spacing between them.
Added new capability of generating step charts,
which are like scatter plots, but have step-like lines connecting data
points (and no data symbols are permitted to overlay data points).
Added new capability of generating bubble charts.
Added a new option to show range-axis error bars on scatter plots
(percentage-based only; choices are: None, 3%, 5%, 10%, 20%, 30%, and 50%). At this time,
there is no easy way of completely shutting off error bars for
individual data series. The alternative is to set the error bars of
data series with no error bars to zero, but this leaves an artifact
that appears to be slightly conspicuous dash marks plotted at data points in the series.
A workaround is to plot filled symbols over the data points to
cover up the artifact. Special logic has been implemented to assure
that the artifact is completely eliminated when none of the data
series in the plot have error bars.
Modified the table-import capability with a new option to import the
data from a file formatted to be compatible with loading a PostgreSQL table via the
psql client.
Modified the table-export capability with a new option to export the
data to a file formatted to be compatible with loading a PostgreSQL table via the
psql client.
Modified the TablePrinter class to gracefully abort the print job for tables that require more than
100 pages (50 double-sided pages).
Modified the table importer to transform "-Inf" and "Inf" values into
null values, so that the column is classified as numerical for
statistics and plotting purposes.
Modified the table exporter to omit spaces around the delimiter when
creating a simple plain-text table file.
Modified the table importer to display an error dialog when attempting
to read a simple delimited data table from a plain-text file that has
more data columns than header columns (the case for fewer data columns
is already being handled).
Added new capability of generating polar charts.
v. 3.3 (8/6/15)
Modified the table importer to more robustly
handle comments in IPAC-tables files, which
begin with backslashes according to
convention, especially backslashes with
blanks that create white space within
comment blocks.
v. 3.2 (6/18/15)
Made changes to the bar-chart plotting to allow
more than one data series per graph.
Fixed bug: There was a mislabeled label on the bar-chart
control panel that should have been "Bar-label font size:".
v. 3.1 (6/17/15)
Improved the organization of the pie-chart and bar-chart control panels.
Added pie-chart controls to explode slices a selected amount, and
to change the slice-label font size.
Augmented the pie-chart slice labels with counts and percentages.
Added a "Statistics Table" button to the statistics panel, whose action
is to compute and display in the Main-GUI panel a column-statistics table of
the tabular data in the currently selected tabbed pane.
Added the following new statistics calculations: 2nd, 9th, 25th, 75th, 91st, and
98th percentiles (commonly used in box-and-whisker charts).
Modified the bar-chart plotting to optionally allow a logarithmic
range axis, and added controls for choosing the bar color and setting
the bar-label font size.
Added the capability of clicking on the bar charts to pick
off and display plot coordinates.
Modified the table importer to recognize table columns with
DATE, TIME, and TIMESTAMP data types, and made it so the
SQLite tables in the scratch database can have these types
(as opposed to simply VARCHAR columns).
Modified the Gantt-chart plotting to have a control for choosing the bar color.
Did some restructuring to simplify the code base.
Included more graph examples in the documentation.
v. 3.0 (5/19/15)
Made changes to the histogram-plotting functionality to allow
more than one data series per graph.
Rearranged the scatter-plot control panel slightly, and
made major improvements to the histogram-plot control panel.
Rearranged the buttons on the Main-GUI panel to better represent
the work flow.
Modified the display of the text representation of a table to include
the IPAC-table header or the FITS header, if present.
Made it so all header lines begin with a backslash for
easy parsing (this is consistent with the IPAC-table
convention).
Fixed bug that was preventing a newly added database connection
from being properly saved as preferences in thoth.run.properties
in the user's ~/.Thoth hidden directory (this file is automatically
loaded upon session start-up).
Fixed bug that was preventing the Main-GUI-panel labels from being updated
after a tabbed pane for a table is closed (via the red "x" button on the tabbed pane).
Added capability to plot two-dimensional histograms in either
grayscale or false color. Tweaked the colors in the rainbow color table
for maximal color discrimination by eye.
Added capability of clicking on the scatter plots and 1-D & 2-D histograms to pick
off and display plot coordinates.
Improved the documentation.
v. 2.9 (3/12/15)
Made changes to the scatter-plot functionality to allow
more than one data series per graph.
Modified the table importer to transform NaN values into
null values, so that they are ignored when plotting, etc.
v. 2.8 (1/29/15)
Added the capability of inverting domain and/or range
axes on scatter plots (useful in astronomy for
plotting apparent magnitude on an inverted axis,
so that brighter is higher as intuitively expected).
Added the capability of specifying the data-point
symbol shape on scatter plots, and whether the
symbol is to be filled or left open.
v. 2.7 (1/13/15)
Added new function getColumnDims to TableHDU class
in nom.tam.fits package, needed for parsing
Kepler images with non-square postage stamps, which
are displayed on the Kepler-movie-player panel.
Added better NaN handling for Kepler data, which
are integrated (sum - count * median) in the
table display for the RAW_CNTS, FLUX, FLUX_ERR,
FLUX_BKG, FLUX_BKG_ERR, and COSMIC_RAYS columns.
v. 2.6 (10/24/14)
Modified the software to transform multi-word column names
in IPAC tables into single-word column names by replacing
spaces with underbars, in order to avoid messy issues related
to multi-word column names.
Modified the isDouble function in the TableImporter class
to return boolean true in the case of a NaN (not a number).
v. 2.5 (9/18/14)
Modified the software to handle the various
postage-stamp sizes in the K2 campaign-0 data.
It now on-the-fly determines the postage-stamp size for
each Kepler data cube.
v. 2.4 (9/12/14)
Minor bug fix: Added code to catch an ArrayIndexOutOfBoundsException
for the image display on the Kepler-movie-player panel.
Also, added related logic to set the default cursor when the
mouse cursor is not on the image.
Modified the data-file parser to recognize Kepler data by
"ktwo" in the filename (as well as "kplr").
Added a slider to the Kepler movie player for easily
changing the frame starting position.
v. 2.3 (8/31/14)
Modified the Kepler-movie-player panel to be automatically resized
when a different movie magnification is selected from one of three
options: 5x, 10x, and 20x.
Added a checkbox option to the "Scatter Plot of Query Results"
panel for connecting data points with lines.
Data are visualized very differently when data points are
connected by lines vs. when they are not.
Added logic to cancel changing pie-chart colors if the "Cancel" button
is clicked for any one pie-chart wedge. This allows a reprieve if a foolish
attempt is made to change colors for a pie chart with way too many wedges.
Edited some of this documentation for greater precision in communication.
v. 2.2 (7/31/14)
Added the capability of plotting an image histogram of the
currently-displayed frame on the Kepler movie player for diagnostic purposes.
v. 2.1 (7/30/14)
Added a label display of the real-time mouse-cursor values on the Kepler movie player,
which change as the mouse cursor is moved across the displayed image.
Fixed minor bug that was preventing the data ranges of the color-table swatches on the
Kepler movie player from being updated when the image stretch is changed.
Also, fixed quantization errors in data-to-color assignments for the
displayed image.
v. 2.0 (7/29/14)
On the Kepler movie player, added the computation of the shift associated with the
maximum correlation from one image to the next in the image sequence.
The (X, Y) shift is now displayed on the Keplery movie player.
v. 1.9 (7/25/14)
Fixed minor bug that was preventing the frame rate on the Kepler movie
player from being changed easily and kept sticky.
Fixed minor bug that was preventing the color-table swatches on the
Kepler movie player from being initialized with tool tips that
display the corresponding data ranges.
v. 1.8 (7/18/14)
Added menu item "Print" under new menu-bar category "Table".
Added control-p functionality to the "Print" menu item for non-Mac
machines, and similar command-p functionality for Macs.
Also, added menu items "Import", "Export", and "Clipboard"
under the "Table" menu-bar category.
Bug fix: Modified the TableImporter class to set the column flags,
so that an exception is not raised when attempting to plot the data.
Added a software "easter egg" to display a movie when a Kepler FITS binary
file containing image-data cubes is imported. The movie player opens
automatically for Kepler data.
v. 1.7 (6/4/14)
Added the capability of printing out a table,
either on paper or in a PDF or PostScript file.
v. 1.6 (6/3/14)
Did some code restructuring to remove the limitation of having data
tables with no more than 1000 columns and make the software more
memory efficient.
v. 1.5 (5/30/14)
Replaced the gray-scale delete-button image
on the selected query-results tabbed-pane tab
with one that is striking red in color.
Upgraded dependencies to jfreechart-1.0.17
and jcommon-1.0.21.
Added simple Gantt-chart capability.
Modified the SQLite table writer to handle
timestamps, times, and dates not as
strings, but as their respective
data types.
Fixed a minor bug in the histogram plotting.
v. 1.4 (5/20/14)
Added close buttons (x) to the query-results tabbed-pane tabs.
Added load, save, and list functionality to the Preferences panel.
Made structural improvements to the code.
v. 1.3 (3/28/14)
Changed the font face for displaying
tablular data from Monaco
to Lucida Console.
Increased the height of the table cells
by 5 pixels to space the rows of tabular
data more for readability.
Modified the software to display an alternate plain-text
representation of the table, so that the table, with headings,
can be copied and pasted.
Modified the software to automatically copy the plain-text
representation of the table onto the system clipboard for tables
that have less than 5000 rows (this may be too time-consuming for very
large tables),
right after a query returns results or when a table is imported
from a file or when a different Thoth# tabbed pane is
selected, so that the entire table can be
easily pasted into a text editor.
Modified the table-import capability to
import FITS ASCII and binary
tables (containing no more than one data unit).
Also, added code to disable all relevant buttons
when importing a table (which can take time for
large tables).
Modified the table-export capability to
output the same formats that can be imported.
The user can chose from several different output
formats available: various column delimiters for
simple table formats, IPAC tables, or
FITS ASCII or binary tables.
Added a "Clipboard" button to the Main-GUI panel,
whose action is to copy the plain-text representation
of the currently selected table to the system
clipboard, regardless of the table's size.
Added a window listener to the "Table Import" panel
so that no matter how the window is closed, the
required cancel actions are executed.
Added more tool tips, and made improvements to the documentation.
v. 1.2 (1/15/14)
Modified the software to automatically
make a connection with the SQLite
scratch database that Thoth creates in the
.Thoth hidden directory of the user's
home directory when starting a new Thoth session.
Added more bullet-proofing and error checking
to the software for the "Connections" and
"Import Table" panels.
Modified the software to create a new
table in ~/.Thoth/thoth.db when a
table is imported from a file (as opposed
to only when from a relational database), as this was
not being done until now.
Disabled the "Change Database" button
while a query is running.
Added to the set of statistical calculations the
mean absolute deviation based on the median value.
v. 1.1 (12/10/13)
Modified the "Query Selection" panel to
remember the last selected tabbed pane
(within a session only).
Modified the table importer to allow the user to chose
from several different column delimiters, and also the
option of importing an IPAC table file with header keywords
and multi-row headers (which are ignored, except for the
row with the column headings).
Added code to explicitly sort the thoth.query.name.properties files,
so that the tabbed panes containing the
canned queries will have name labels in lexical order.
Modified the table exporter to add white space
around each delimiter in the table header row
(so that it is similar to the rest of the
table rows).
Created a Windows NSI executable for Thoth.
For non-Macs, changed the savePreferences method
to save preferences in thoth.run.properties
in the user's ~/.Thoth hidden directory
(this file is automatically
loaded upon session start-up).
v. 1.0 (11/25/13)
Modified the bars on the histogram plot to
be solid black, rather than have the default
3-D effect.
Added a pop-up dialog to inform the user if a
database connection cannot be made (a SQL
exception is trapped and now raised again).
Modified the software to output the user
preferences in lexical order when saving
them to a file.
Modified the software to organize the
canned queries into separate files with
filenames like thoth.query.name.properties,
where name can be an arbitrarily assigned
name that makes a useful association with the
type of canned queries contained therein.
The canned queries are displayed for user
selection on tabbed panels with these same
names.
Simplified the "Plot Query Results" panel
to just have a few drill-down buttons. There
are now separate panels for scatter plots,
histograms, pie charts, and bar charts.
Modified the "Scatter Plot of Query Results" panel
to have a horizontal rather than vertical
layout, which will fit better on smaller
compute screens and allow more parameters
to be added.
Added a control the "Scatter Plot of Query Results" panel
to change the scatter-plot symbol size.
Added pie-chart and bar-chart capability.
v. 0.9 (11/15/13)
Bug fix: Modified the software to move
new database connections to the properties, and remove
deleted connections from the properties, so that
saved user preferences will reflect these additions
and deletions.
Bug fix: Overwrite the current version number
in the properties, so that it will stay current.
v. 0.8 (10/21/13)
Raised the maximum Java heap space from 512 Mbytes to 4096 Mbytes.
Included in the package additional jar files for the HyperSQL and
Oracle JBDC drivers.
Modified the software to allow multiple database connections, which
can be added to the thoth.run.properties file by incrementing a suffix
counter. A minimum of one database connection is required in the
thoth.run.properties file, and this is specified by the following
property name/value pairs (the names of which have been changed since
the previous software version):
| Old property name | New property name |
|---|
|
connectionMoniker
|
connectionMoniker1
|
|
jdbDriver
|
jdbcDriver1
|
|
databaseUrl
|
databaseUrl1
|
|
userName
|
userName1
|
|
password
|
password1
|
|
defaultQuery
|
defaultQuery1
|
Modified the code base to have improved memory management.
Modified Thoth to automatically delete the existing ~/.Thoth/thoth.db
(the SQLite scratch database) upon start-up.
Modified Thoth to remember the last database query selected from the
"Query Selection" panel. Added a label to the Thoth Main-GUI panel
that gives the name of the database being queried.
Added a progress bar to the Thoth Main-GUI panel.
Added new statistic calculations: sum, skewness, kurtosis, and
Jarque-Bera test.
v. 0.7 (10/10/13)
Bug fix: Restored the missing statistic labels
on the "Data Statistics" panel.
v. 0.6 (10/9/13)
Added bullet-proofing in picking a data column
for the initial statistics computation in the constructor
of the QueryResultsStatistics class.
Added bullet-proofing in picking x and y data columns
for the initial plot parameters in the constructor
of the QueryResultsPlot class.
Modfied the scatter- and histogram-plot panels to pop up near the main
GUI, and modified their "Close" buttons to have focus. Modified
the "About" panel to pop up near the Main-GUI panel. (These were
oversights in the last revision).
Removed the table-column sorter, as it does not handle NULL date values
(and raises java.lang.IllegalArgumentException: Cannot format given
Object as a Date in these instances).
Added a border title with helpful instructions around the SQL-query
input box.
Modified each Thoth table to carry with it the original database
query, or the message "Data imported from file" for imported
tables, and to also carry with each query the number of rows returned.
Modified the software to propagate more detailed SQL-exception
messages to the message dialog displayed for the user, in
order to debug database queries more effectively.
Updated the package to have a more up-to-date SQLite JDBC driver,
Taro Saito's sqlite-jdbc-3.7.15-M1.jar (vs. Zentu's
sqlitejdbc-v056.jar, which was used previously).
v. 0.5 (10/7/13)
Did some refactoring to improve the code structure.
Added GUI size and screen location to the user preferences.
Modified the software to save the user preferences
to the default filename in the ~/.Thoth hidden directory
(this file, called "thoth.run.properties", is automatically
loaded upon session start-up). Modified the software to
list the preferences when the "Preferences" option is
selected in the application menu.
Modified the software to look for thoth.run.properties and
thoth.query.properties in the user's home directory (~/) if it cannot find them
in the ~/.Thoth hidden directory. If not found in the user's home
directory, the software will look in the resources directory in
the software package.
Modfied all child panels to pop up near the Main-GUI panel.
Modified the "Close" button on child panels to have focus.
Made it so no more than one instance of a given child panel is popped up.
Added a pop-up dialog to inform the user if a SQL
exception is raised.
Added functionality to the table headings to sort a selected column, by
cycling through three possible states:
- the data order as returned from the database (no icon shown on heading-title bar),
- ascending-order sorted (up-arrow icon), and
- descending-order sorted (down-arrow icon).
v. 0.4 (6/21/10)
Made mouse cursor switch to Cursor.WAIT_CURSOR when querying
a database, in order to indicate to the user that the
software is busy.
Modified software to load query results into tabbed panels, and to
plot and compute statistics for the currently selected tabbed panel.
Removed "Submit Query" button from query-selection panel, in
order to simplify the coding.
Modified the software to look for thoth.run.properties and
thoth.query.properties in ~/.Thoth if it cannot find them
in the user's home directory (~/).
Modified the software to store each returned table in a
SQLite database called thoth.db in the working directory
(currently hardwired to hidden directory ~/.Thoth),
where table names are "Thoth0", "Thoth1", etc.
Added "Export Table" and "Import Table" options.
v. 0.3 (6/14/10)
Added support for Sqlite databases. Customized the
returned-rows table font (Courier, 10 pt.). Modified
the software to a better job of computing column widths,
handling null values and zero values, and formatting
tabulated numbers. Modified "About & Help" panel
to open with scroll bar positioned at top of the page.
Modified the returned-rows table to have alternating
white and blue row background colors for readability.
v. 0.2 (6/10/10)
Dealt with packaging issues for the various platforms.
v. 0.1 (6/9/10)
Initial release of beta-test version.
JFreeChart software is harnessed for graph generation and display (www.jfree.org).
Also, use in this software is made of the JRegEx
(jregex.sourceforge.net) and nom.tam.fits (http://fits.gsfc.nasa.gov/fits_libraries.html) packages.
You are granted permission to use Thoth only for any legal, legitimate, and honorable
research, education, business, or personal application. Any use of
Thoth for purposes that do not adhere to these restictions is strictly
prohibited. The terms of this license are subject to change without notice.
In no event and under no legal theory, whether in tort (including
negligence), contract, or otherwise, unless required by applicable law
(such as deliberate and grossly negligent acts) or agreed to in
writing, shall the creator of Thoth or California
Institute of Technology be liable to users of the software for
damages, including any direct, indirect, special, incidental, or
consequential damages of any character arising as a result of this
License or out of the use or inability to use the software (including
but not limited to damages for loss of goodwill, work stoppage,
computer failure or malfunction, or any and all other commercial
damages or losses), even if the creator of Thoth
has been advised of the possibility of such damages.
Thoth is distributed
WITHOUT ANY WARRANTY; WITHOUT ANY IMPLIED WARRANTY OF
MERCHANTABILITY or FITNESS FOR A PARTICULAR PURPOSE.
|