Hot Pixel Analysis--- 970418n

NOTE: DO NOT EDIT THIS FILE! It is generated dynamically by software.
Night/hemisphere dataset: 970418n

22 scans (in low density regions) identified for analysis:
s001 s002 s003 s004 s005 s006 s007 s008 s009 s019 s021 s022 s023 s024 s025 s026 s027 s028 s029 s030 s031 s032

Procedures performed are outlined in Data Processing

Results

Figure 1---
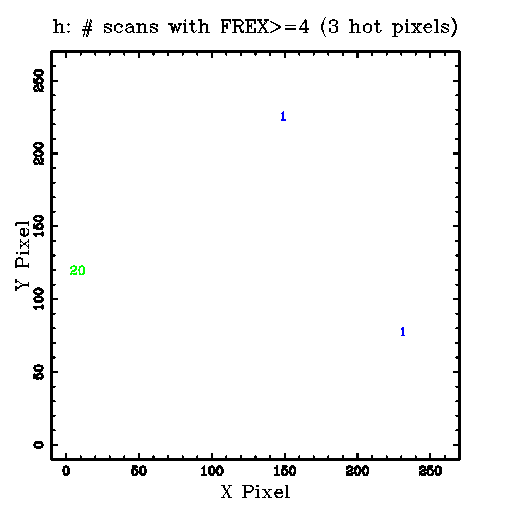
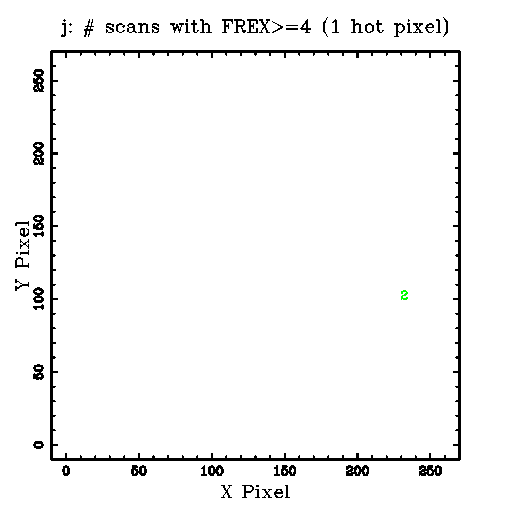
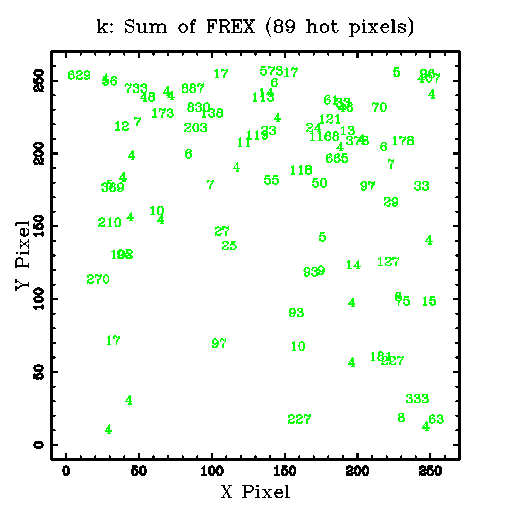
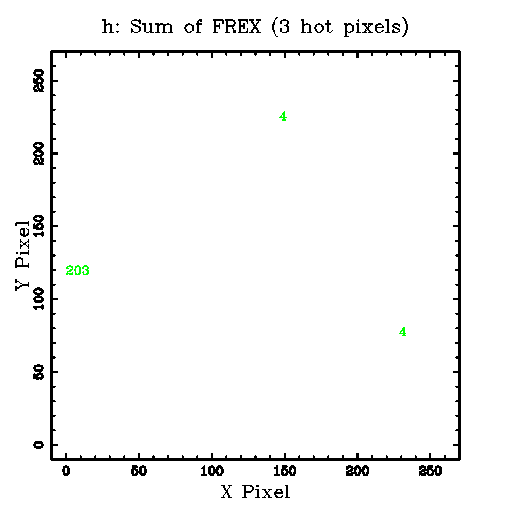
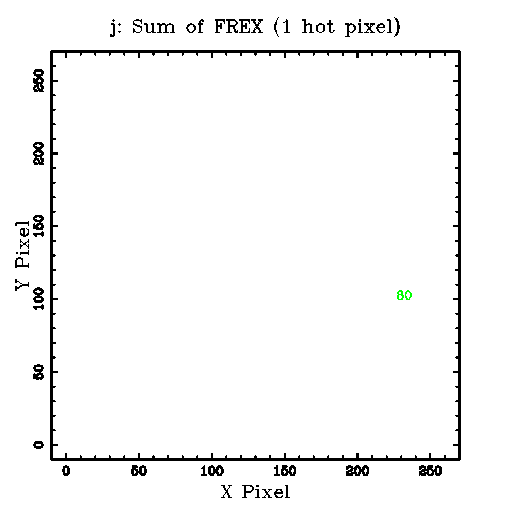
Row 1: The sum (coadd=stack) of 22 FREX (>=4) images. The plotted numbers indicate the sum of the FREX values at each pixel. Links to the FITS images are given below the K, H and J panel.
Row 2: The plotted numbers indicate the number of scans (1-22) in which FREX>=4 was found for each hot pixel.
Below the K, H and J panel are links to the corresponding tabular data.

K H J
1) Sum of FREX Images:
Tabular Data
OR mask in Fowler's Format
FITS Image
Tabular Data
OR mask in Fowler's Format
FITS Image
Tabular Data
OR mask in Fowler's Format
FITS Image
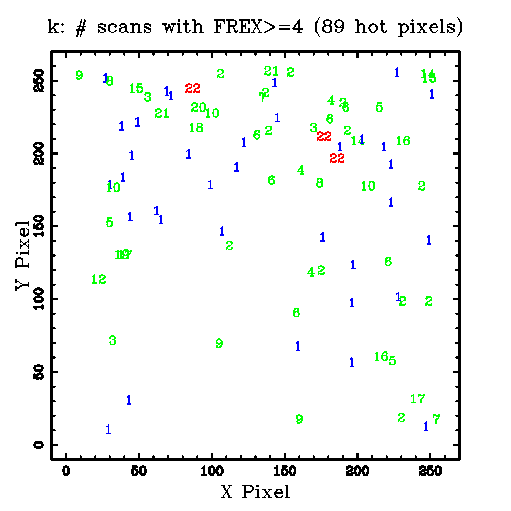
2) Scan Counts:
k.scan_cnt.tbl

h.scan_cnt.tbl

j.scan_cnt.tbl


Figure 2---
Histograms, CDFs, and comparison statistics for K-array FREX distributions.

Row 1: Data for the coadd (stack=sum) of 22 FREX (>=4) images.
Following 22 rows: Data for each scan.
Under each CDF plot is a link to the data file, and the p-level for the two-sample KS statistic. After the histogram and CFD plot are rows listing the number of points, median, mean, p-level for the Student's t test for different means, standard deviation, p-level for the F test for different variances, and a link to the original statistics program output file.

Histogram
cdf data file
CDF
cdf data file
p(KS test)
# PointsMedian
Mean
p(t)
Std
p(F)
Statistics file

k.fex.stack.hot.tbl
k.fex.stack.hot.tbl.frex-only.cdf

k.fex.stack.hot.tbl.frex-only.cdf
p(KS test)=0.000000.
Npts=89 Median=27
Mean=124
p(t)=1.000000
Std=220
p(F)=1.000000
k.fex.stack.hot.tbl.frex-only.stats

k001.fex.hot.tbl
k001.fex.hot.tbl.frex-only.cdf

k001.fex.hot.tbl.frex-only.cdf
p(KS test)=0.000000.
Npts=26 Median=13
Mean=21.4
p(t)=1.000000
Std=19.7
p(F)=1.000000
k001.fex.hot.tbl.frex-only.stats

k002.fex.hot.tbl
k002.fex.hot.tbl.frex-only.cdf

k002.fex.hot.tbl.frex-only.cdf
p(KS test)=0.814106.
Npts=28 Median=12
Mean=19.6
p(t)=0.750300
Std=20.6
p(F)=0.824952
k002.fex.hot.tbl.frex-only.stats

k003.fex.hot.tbl
k003.fex.hot.tbl.frex-only.cdf

k003.fex.hot.tbl.frex-only.cdf
p(KS test)=0.402204.
Npts=22 Median=9
Mean=22.6
p(t)=0.858730
Std=25.5
p(F)=0.214904
k003.fex.hot.tbl.frex-only.stats

k004.fex.hot.tbl
k004.fex.hot.tbl.frex-only.cdf

k004.fex.hot.tbl.frex-only.cdf
p(KS test)=0.999575.
Npts=23 Median=11
Mean=24.9
p(t)=0.615290
Std=26.6
p(F)=0.145111
k004.fex.hot.tbl.frex-only.stats

k005.fex.hot.tbl
k005.fex.hot.tbl.frex-only.cdf

k005.fex.hot.tbl.frex-only.cdf
p(KS test)=0.807752.
Npts=22 Median=12.5
Mean=21.9
p(t)=0.940098
Std=23.5
p(F)=0.389630
k005.fex.hot.tbl.frex-only.stats

k006.fex.hot.tbl
k006.fex.hot.tbl.frex-only.cdf

k006.fex.hot.tbl.frex-only.cdf
p(KS test)=0.992559.
Npts=27 Median=16
Mean=19.3
p(t)=0.683789
Std=17.4
p(F)=0.531562
k006.fex.hot.tbl.frex-only.stats

k007.fex.hot.tbl
k007.fex.hot.tbl.frex-only.cdf

k007.fex.hot.tbl.frex-only.cdf
p(KS test)=0.965084.
Npts=24 Median=12
Mean=23.8
p(t)=0.726013
Std=25.5
p(F)=0.204181
k007.fex.hot.tbl.frex-only.stats

k008.fex.hot.tbl
k008.fex.hot.tbl.frex-only.cdf

k008.fex.hot.tbl.frex-only.cdf
p(KS test)=0.991617.
Npts=22 Median=13.5
Mean=24.9
p(t)=0.608127
Std=24.7
p(F)=0.276015
k008.fex.hot.tbl.frex-only.stats

k009.fex.hot.tbl
k009.fex.hot.tbl.frex-only.cdf

k009.fex.hot.tbl.frex-only.cdf
p(KS test)=0.712643.
Npts=21 Median=17
Mean=22.5
p(t)=0.843422
Std=17.6
p(F)=0.618588
k009.fex.hot.tbl.frex-only.stats

k019.fex.hot.tbl
k019.fex.hot.tbl.frex-only.cdf

k019.fex.hot.tbl.frex-only.cdf
p(KS test)=0.918018.
Npts=26 Median=13
Mean=20.3
p(t)=0.847234
Std=19.8
p(F)=0.970506
k019.fex.hot.tbl.frex-only.stats

k021.fex.hot.tbl
k021.fex.hot.tbl.frex-only.cdf

k021.fex.hot.tbl.frex-only.cdf
p(KS test)=0.987466.
Npts=23 Median=11
Mean=19
p(t)=0.658340
Std=18.4
p(F)=0.751762
k021.fex.hot.tbl.frex-only.stats

k022.fex.hot.tbl
k022.fex.hot.tbl.frex-only.cdf

k022.fex.hot.tbl.frex-only.cdf
p(KS test)=0.995166.
Npts=26 Median=13
Mean=22.9
p(t)=0.821029
Std=25.6
p(F)=0.196539
k022.fex.hot.tbl.frex-only.stats

k023.fex.hot.tbl
k023.fex.hot.tbl.frex-only.cdf

k023.fex.hot.tbl.frex-only.cdf
p(KS test)=0.941792.
Npts=18 Median=14.5
Mean=31.9
p(t)=0.292369
Std=36.5
p(F)=0.005173
k023.fex.hot.tbl.frex-only.stats

k024.fex.hot.tbl
k024.fex.hot.tbl.frex-only.cdf

k024.fex.hot.tbl.frex-only.cdf
p(KS test)=0.960224.
Npts=21 Median=17
Mean=23.8
p(t)=0.732540
Std=25.7
p(F)=0.203860
k024.fex.hot.tbl.frex-only.stats

k025.fex.hot.tbl
k025.fex.hot.tbl.frex-only.cdf

k025.fex.hot.tbl.frex-only.cdf
p(KS test)=0.783513.
Npts=21 Median=14
Mean=16.9
p(t)=0.360481
Std=13
p(F)=0.062472
k025.fex.hot.tbl.frex-only.stats

k026.fex.hot.tbl
k026.fex.hot.tbl.frex-only.cdf

k026.fex.hot.tbl.frex-only.cdf
p(KS test)=0.630942.
Npts=23 Median=24
Mean=26.3
p(t)=0.509461
Std=29.4
p(F)=0.054927
k026.fex.hot.tbl.frex-only.stats

k027.fex.hot.tbl
k027.fex.hot.tbl.frex-only.cdf

k027.fex.hot.tbl.frex-only.cdf
p(KS test)=0.843378.
Npts=28 Median=12.5
Mean=17.1
p(t)=0.404074
Std=16.5
p(F)=0.376725
k027.fex.hot.tbl.frex-only.stats

k028.fex.hot.tbl
k028.fex.hot.tbl.frex-only.cdf

k028.fex.hot.tbl.frex-only.cdf
p(KS test)=0.970649.
Npts=25 Median=10
Mean=19
p(t)=0.658819
Std=18.6
p(F)=0.781141
k028.fex.hot.tbl.frex-only.stats

k029.fex.hot.tbl
k029.fex.hot.tbl.frex-only.cdf

k029.fex.hot.tbl.frex-only.cdf
p(KS test)=0.751441.
Npts=25 Median=12
Mean=15.7
p(t)=0.232924
Std=12
p(F)=0.018389
k029.fex.hot.tbl.frex-only.stats

k030.fex.hot.tbl
k030.fex.hot.tbl.frex-only.cdf

k030.fex.hot.tbl.frex-only.cdf
p(KS test)=0.667170.
Npts=28 Median=17.5
Mean=21.9
p(t)=0.930645
Std=19.2
p(F)=0.896791
k030.fex.hot.tbl.frex-only.stats

k031.fex.hot.tbl
k031.fex.hot.tbl.frex-only.cdf

k031.fex.hot.tbl.frex-only.cdf
p(KS test)=0.591446.
Npts=19 Median=8
Mean=16.9
p(t)=0.488441
Std=21.3
p(F)=0.692972
k031.fex.hot.tbl.frex-only.stats

k032.fex.hot.tbl
k032.fex.hot.tbl.frex-only.cdf

k032.fex.hot.tbl.frex-only.cdf
p(KS test)=0.649740.
Npts=21 Median=8
Mean=20
p(t)=0.825706
Std=24.1
p(F)=0.332985
k032.fex.hot.tbl.frex-only.stats


Last update: 6-Jun-97 (7:5:54), Joe Mazzarella (mazz@ipac.caltech.edu )