Hot Pixel Analysis--- 970423n

NOTE: DO NOT EDIT THIS FILE! It is generated dynamically by software.
Night/hemisphere dataset: 970423n

21 scans (in low density regions) identified for analysis:
s049 s050 s051 s052 s053 s054 s073 s074 s075 s076 s077 s078 s079 s080 s093 s094 s095 s096 s097 s098 s099

Procedures performed are outlined in Data Processing

Results

Figure 1---
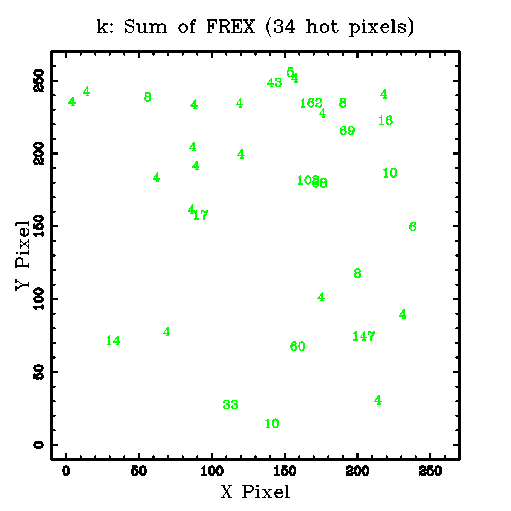
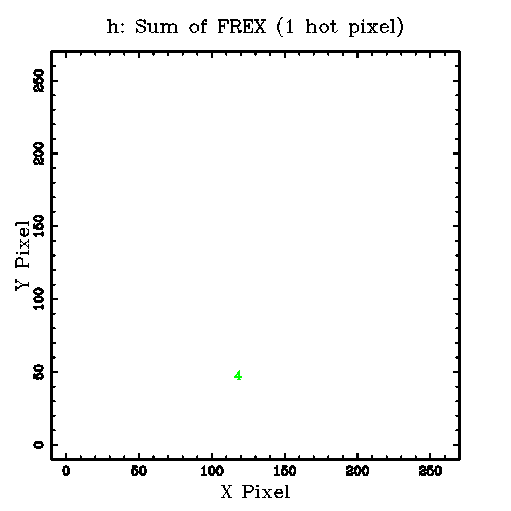
Row 1: The sum (coadd=stack) of 21 FREX (>=4) images. The plotted numbers indicate the sum of the FREX values at each pixel. Links to the FITS images are given below the K, H and J panel.
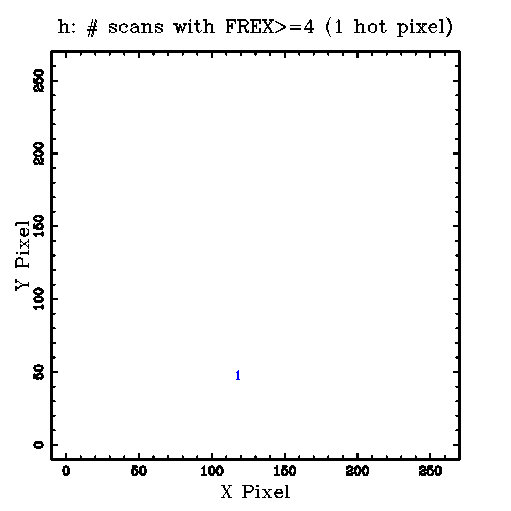
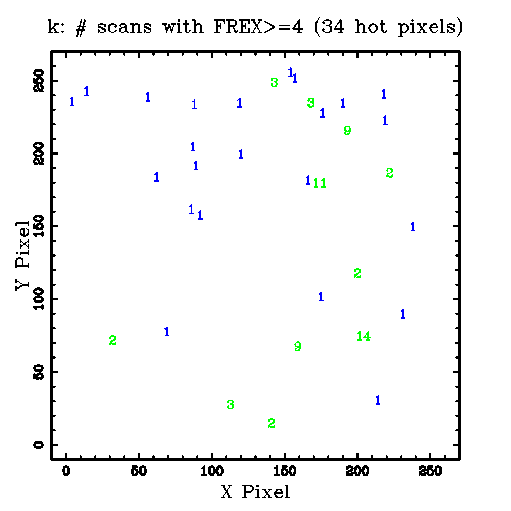
Row 2: The plotted numbers indicate the number of scans (1-21) in which FREX>=4 was found for each hot pixel.
Below the K, H and J panel are links to the corresponding tabular data.

K H J
1) Sum of FREX Images:
Tabular Data
OR mask in Fowler's Format
FITS Image
Tabular Data
OR mask in Fowler's Format
FITS Image
Tabular Data
OR mask in Fowler's Format
FITS Image
2) Scan Counts:
k.scan_cnt.tbl

h.scan_cnt.tbl

j.scan_cnt.tbl


Figure 2---
Histograms, CDFs, and comparison statistics for K-array FREX distributions.

Row 1: Data for the coadd (stack=sum) of 21 FREX (>=4) images.
Following 21 rows: Data for each scan.
Under each CDF plot is a link to the data file, and the p-level for the two-sample KS statistic. After the histogram and CFD plot are rows listing the number of points, median, mean, p-level for the Student's t test for different means, standard deviation, p-level for the F test for different variances, and a link to the original statistics program output file.

Histogram
cdf data file
CDF
cdf data file
p(KS test)
# PointsMedian
Mean
p(t)
Std
p(F)
Statistics file

k.fex.stack.hot.tbl
k.fex.stack.hot.tbl.frex-only.cdf

k.fex.stack.hot.tbl.frex-only.cdf
p(KS test)=0.000000.
Npts=34 Median=5.5
Mean=25
p(t)=1.000000
Std=40.7
p(F)=1.000000
k.fex.stack.hot.tbl.frex-only.stats

k049.fex.hot.tbl
k049.fex.hot.tbl.frex-only.cdf

k049.fex.hot.tbl.frex-only.cdf
p(KS test)=0.000000.
Npts=4 Median=5.5
Mean=11
p(t)=1.000000
Std=12.1
p(F)=1.000000
k049.fex.hot.tbl.frex-only.stats

k050.fex.hot.tbl
k050.fex.hot.tbl.frex-only.cdf

k050.fex.hot.tbl.frex-only.cdf
p(KS test)=0.512144.
Npts=5 Median=17
Mean=31.2
p(t)=0.430680
Std=42.3
p(F)=0.066981
k050.fex.hot.tbl.frex-only.stats

k051.fex.hot.tbl
k051.fex.hot.tbl.frex-only.cdf

k051.fex.hot.tbl.frex-only.cdf
p(KS test)=0.998266.
Npts=6 Median=7.5
Mean=11
p(t)=1.000000
Std=8.99
p(F)=0.525225
k051.fex.hot.tbl.frex-only.stats

k052.fex.hot.tbl
k052.fex.hot.tbl.frex-only.cdf

k052.fex.hot.tbl.frex-only.cdf
p(KS test)=0.999633.
Npts=4 Median=6
Mean=6
p(t)=0.522727
Std=1.83
p(F)=0.011247
k052.fex.hot.tbl.frex-only.stats

k053.fex.hot.tbl
k053.fex.hot.tbl.frex-only.cdf

k053.fex.hot.tbl.frex-only.cdf
p(KS test)=0.927221.
Npts=3 Median=14
Mean=12.7
p(t)=0.858376
Std=8.08
p(F)=0.648069
k053.fex.hot.tbl.frex-only.stats

k054.fex.hot.tbl
k054.fex.hot.tbl.frex-only.cdf

k054.fex.hot.tbl.frex-only.cdf
p(KS test)=0.999924.
Npts=3 Median=5
Mean=5.33
p(t)=0.501979
Std=1.53
p(F)=0.031543
k054.fex.hot.tbl.frex-only.stats

k073.fex.hot.tbl
k073.fex.hot.tbl.frex-only.cdf

k073.fex.hot.tbl.frex-only.cdf
p(KS test)=0.999924.
Npts=3 Median=5
Mean=7.67
p(t)=0.699561
Std=5.51
p(F)=0.353637
k073.fex.hot.tbl.frex-only.stats

k074.fex.hot.tbl
k074.fex.hot.tbl.frex-only.cdf

k074.fex.hot.tbl.frex-only.cdf
p(KS test)=0.999067.
Npts=5 Median=6
Mean=9.4
p(t)=0.848345
Std=8.88
p(F)=0.556370
k074.fex.hot.tbl.frex-only.stats

k075.fex.hot.tbl
k075.fex.hot.tbl.frex-only.cdf

k075.fex.hot.tbl.frex-only.cdf
p(KS test)=0.999633.
Npts=4 Median=4
Mean=28.8
p(t)=0.578013
Std=49.5
p(F)=0.044506
k075.fex.hot.tbl.frex-only.stats

k076.fex.hot.tbl
k076.fex.hot.tbl.frex-only.cdf

k076.fex.hot.tbl.frex-only.cdf
p(KS test)=0.927221.
Npts=3 Median=12
Mean=9.33
p(t)=0.837053
Std=4.62
p(F)=0.260297
k076.fex.hot.tbl.frex-only.stats

k077.fex.hot.tbl
k077.fex.hot.tbl.frex-only.cdf

k077.fex.hot.tbl.frex-only.cdf
p(KS test)=0.699374.
Npts=4 Median=7
Mean=8.75
p(t)=0.772765
Std=4.99
p(F)=0.180496
k077.fex.hot.tbl.frex-only.stats

k078.fex.hot.tbl
k078.fex.hot.tbl.frex-only.cdf

k078.fex.hot.tbl.frex-only.cdf
p(KS test)=0.999633.
Npts=4 Median=5
Mean=9.75
p(t)=0.893043
Std=10.2
p(F)=0.788571
k078.fex.hot.tbl.frex-only.stats

k079.fex.hot.tbl
k079.fex.hot.tbl.frex-only.cdf

k079.fex.hot.tbl.frex-only.cdf
p(KS test)=0.699374.
Npts=4 Median=8
Mean=8.5
p(t)=0.735658
Std=2.52
p(F)=0.028421
k079.fex.hot.tbl.frex-only.stats

k080.fex.hot.tbl
k080.fex.hot.tbl.frex-only.cdf

k080.fex.hot.tbl.frex-only.cdf
p(KS test)=0.699374.
Npts=4 Median=7
Mean=10.2
p(t)=0.927507
Std=7.18
p(F)=0.415595
k080.fex.hot.tbl.frex-only.stats

k093.fex.hot.tbl
k093.fex.hot.tbl.frex-only.cdf

k093.fex.hot.tbl.frex-only.cdf
p(KS test)=0.784770.
Npts=3 Median=5
Mean=5
p(t)=0.480669
Std=1
p(F)=0.013621
k093.fex.hot.tbl.frex-only.stats

k094.fex.hot.tbl
k094.fex.hot.tbl.frex-only.cdf

k094.fex.hot.tbl.frex-only.cdf
p(KS test)=0.784770.
Npts=3 Median=4
Mean=4
p(t)=0.427255
Std=0
p(F)=0.000000
k094.fex.hot.tbl.frex-only.stats

k095.fex.hot.tbl
k095.fex.hot.tbl.frex-only.cdf

k095.fex.hot.tbl.frex-only.cdf
p(KS test)=0.699374.
Npts=4 Median=7
Mean=8.75
p(t)=0.774003
Std=5.19
p(F)=0.198497
k095.fex.hot.tbl.frex-only.stats

k096.fex.hot.tbl
k096.fex.hot.tbl.frex-only.cdf

k096.fex.hot.tbl.frex-only.cdf
p(KS test)=0.999924.
Npts=3 Median=4
Mean=5
p(t)=0.483699
Std=1.73
p(F)=0.040403
k096.fex.hot.tbl.frex-only.stats

k097.fex.hot.tbl
k097.fex.hot.tbl.frex-only.cdf

k097.fex.hot.tbl.frex-only.cdf
p(KS test)=0.988261.
Npts=5 Median=4
Mean=5.4
p(t)=0.472235
Std=2.61
p(F)=0.012567
k097.fex.hot.tbl.frex-only.stats

k098.fex.hot.tbl
k098.fex.hot.tbl.frex-only.cdf

k098.fex.hot.tbl.frex-only.cdf
p(KS test)=0.634989.
Npts=5 Median=4
Mean=4.8
p(t)=0.428855
Std=1.1
p(F)=0.000439
k098.fex.hot.tbl.frex-only.stats

k099.fex.hot.tbl
k099.fex.hot.tbl.frex-only.cdf

k099.fex.hot.tbl.frex-only.cdf
p(KS test)=0.699374.
Npts=4 Median=4
Mean=4.25
p(t)=0.411636
Std=0.5
p(F)=0.000240
k099.fex.hot.tbl.frex-only.stats


Last update: 6-Jun-97 (7:8:14), Joe Mazzarella (mazz@ipac.caltech.edu )