Hot Pixel Analysis--- 970424n

NOTE: DO NOT EDIT THIS FILE! It is generated dynamically by software.
Night/hemisphere dataset: 970424n

28 scans (in low density regions) identified for analysis:
s015 s016 s017 s018 s019 s020 s021 s022 s023 s049 s050 s051 s052 s054 s073 s074 s075 s076 s077 s078 s079 s080 s093 s094 s095 s096 s097 s099

Procedures performed are outlined in Data Processing

Results

Figure 1---
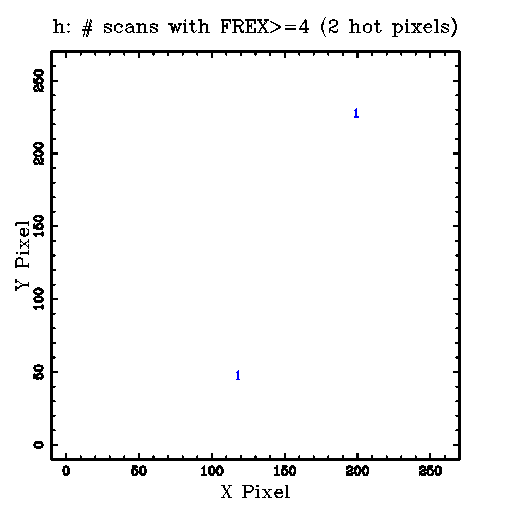
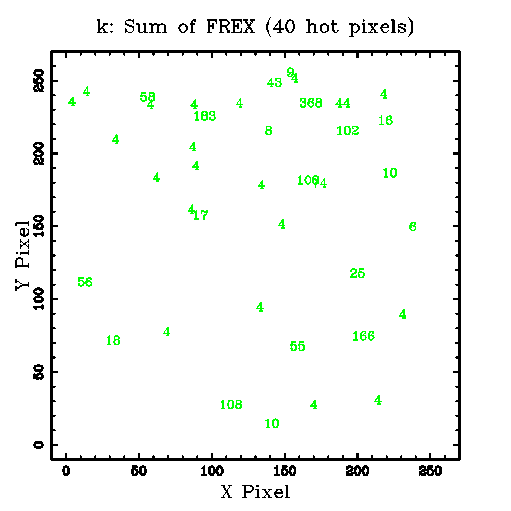
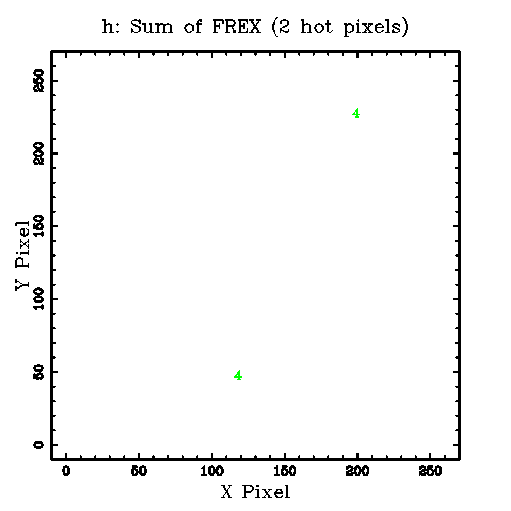
Row 1: The sum (coadd=stack) of 28 FREX (>=4) images. The plotted numbers indicate the sum of the FREX values at each pixel. Links to the FITS images are given below the K, H and J panel.
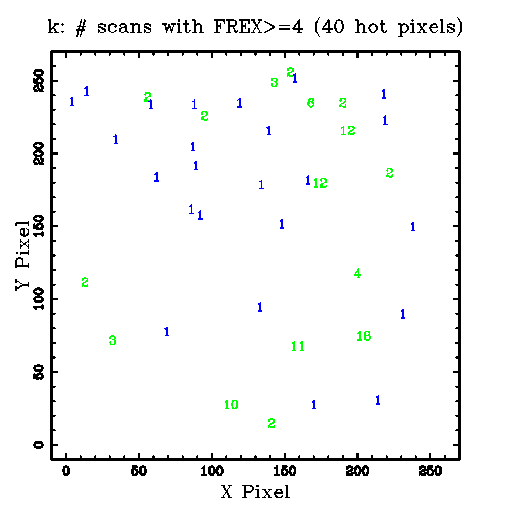
Row 2: The plotted numbers indicate the number of scans (1-28) in which FREX>=4 was found for each hot pixel.
Below the K, H and J panel are links to the corresponding tabular data.

K H J
1) Sum of FREX Images:
Tabular Data
OR mask in Fowler's Format
FITS Image
Tabular Data
OR mask in Fowler's Format
FITS Image
Tabular Data
OR mask in Fowler's Format
FITS Image
2) Scan Counts:
k.scan_cnt.tbl

h.scan_cnt.tbl

j.scan_cnt.tbl


Figure 2---
Histograms, CDFs, and comparison statistics for K-array FREX distributions.

Row 1: Data for the coadd (stack=sum) of 28 FREX (>=4) images.
Following 28 rows: Data for each scan.
Under each CDF plot is a link to the data file, and the p-level for the two-sample KS statistic. After the histogram and CFD plot are rows listing the number of points, median, mean, p-level for the Student's t test for different means, standard deviation, p-level for the F test for different variances, and a link to the original statistics program output file.

Histogram
cdf data file
CDF
cdf data file
p(KS test)
# PointsMedian
Mean
p(t)
Std
p(F)
Statistics file

k.fex.stack.hot.tbl
k.fex.stack.hot.tbl.frex-only.cdf

k.fex.stack.hot.tbl.frex-only.cdf
p(KS test)=0.000000.
Npts=40 Median=7
Mean=38.9
p(t)=1.000000
Std=69.7
p(F)=1.000000
k.fex.stack.hot.tbl.frex-only.stats

k015.fex.hot.tbl
k015.fex.hot.tbl.frex-only.cdf

k015.fex.hot.tbl.frex-only.cdf
p(KS test)=0.000000.
Npts=4 Median=4
Mean=4.75
p(t)=1.000000
Std=1.5
p(F)=1.000000
k015.fex.hot.tbl.frex-only.stats

k016.fex.hot.tbl
k016.fex.hot.tbl.frex-only.cdf

k016.fex.hot.tbl.frex-only.cdf
p(KS test)=0.210552.
Npts=4 Median=11.5
Mean=13.2
p(t)=0.263226
Std=9.64
p(F)=0.012255
k016.fex.hot.tbl.frex-only.stats

k017.fex.hot.tbl
k017.fex.hot.tbl.frex-only.cdf

k017.fex.hot.tbl.frex-only.cdf
p(KS test)=0.400471.
Npts=5 Median=8
Mean=7.6
p(t)=0.282861
Std=3.78
p(F)=0.160602
k017.fex.hot.tbl.frex-only.stats

k018.fex.hot.tbl
k018.fex.hot.tbl.frex-only.cdf

k018.fex.hot.tbl.frex-only.cdf
p(KS test)=0.164079.
Npts=5 Median=8
Mean=15.6
p(t)=0.325129
Std=17.8
p(F)=0.001936
k018.fex.hot.tbl.frex-only.stats

k019.fex.hot.tbl
k019.fex.hot.tbl.frex-only.cdf

k019.fex.hot.tbl.frex-only.cdf
p(KS test)=0.164079.
Npts=5 Median=8
Mean=24.8
p(t)=0.393973
Std=39.9
p(F)=0.000173
k019.fex.hot.tbl.frex-only.stats

k020.fex.hot.tbl
k020.fex.hot.tbl.frex-only.cdf

k020.fex.hot.tbl.frex-only.cdf
p(KS test)=0.927221.
Npts=3 Median=5
Mean=19.7
p(t)=0.482892
Std=26.3
p(F)=0.000679
k020.fex.hot.tbl.frex-only.stats

k021.fex.hot.tbl
k021.fex.hot.tbl.frex-only.cdf

k021.fex.hot.tbl.frex-only.cdf
p(KS test)=0.305113.
Npts=7 Median=9
Mean=32.6
p(t)=0.242449
Std=44.8
p(F)=0.000116
k021.fex.hot.tbl.frex-only.stats

k022.fex.hot.tbl
k022.fex.hot.tbl.frex-only.cdf

k022.fex.hot.tbl.frex-only.cdf
p(KS test)=0.948308.
Npts=5 Median=5
Mean=14.8
p(t)=0.429560
Std=21.9
p(F)=0.001029
k022.fex.hot.tbl.frex-only.stats

k023.fex.hot.tbl
k023.fex.hot.tbl.frex-only.cdf

k023.fex.hot.tbl.frex-only.cdf
p(KS test)=0.210552.
Npts=4 Median=22.5
Mean=23.2
p(t)=0.242616
Std=19.7
p(F)=0.001479
k023.fex.hot.tbl.frex-only.stats

k049.fex.hot.tbl
k049.fex.hot.tbl.frex-only.cdf

k049.fex.hot.tbl.frex-only.cdf
p(KS test)=0.999633.
Npts=4 Median=5.5
Mean=11
p(t)=0.441680
Std=12.1
p(F)=0.006319
k049.fex.hot.tbl.frex-only.stats

k050.fex.hot.tbl
k050.fex.hot.tbl.frex-only.cdf

k050.fex.hot.tbl.frex-only.cdf
p(KS test)=0.116310.
Npts=5 Median=17
Mean=31.2
p(t)=0.315591
Std=42.3
p(F)=0.000145
k050.fex.hot.tbl.frex-only.stats

k051.fex.hot.tbl
k051.fex.hot.tbl.frex-only.cdf

k051.fex.hot.tbl.frex-only.cdf
p(KS test)=0.585970.
Npts=6 Median=7.5
Mean=11
p(t)=0.245292
Std=8.99
p(F)=0.014094
k051.fex.hot.tbl.frex-only.stats

k052.fex.hot.tbl
k052.fex.hot.tbl.frex-only.cdf

k052.fex.hot.tbl.frex-only.cdf
p(KS test)=0.699374.
Npts=4 Median=6
Mean=6
p(t)=0.430853
Std=1.83
p(F)=0.754513
k052.fex.hot.tbl.frex-only.stats

k054.fex.hot.tbl
k054.fex.hot.tbl.frex-only.cdf

k054.fex.hot.tbl.frex-only.cdf
p(KS test)=0.927221.
Npts=3 Median=5
Mean=5.33
p(t)=0.691183
Std=1.53
p(F)=0.909236
k054.fex.hot.tbl.frex-only.stats

k073.fex.hot.tbl
k073.fex.hot.tbl.frex-only.cdf

k073.fex.hot.tbl.frex-only.cdf
p(KS test)=0.927221.
Npts=3 Median=5
Mean=7.67
p(t)=0.515040
Std=5.51
p(F)=0.063363
k073.fex.hot.tbl.frex-only.stats

k074.fex.hot.tbl
k074.fex.hot.tbl.frex-only.cdf

k074.fex.hot.tbl.frex-only.cdf
p(KS test)=0.869164.
Npts=5 Median=6
Mean=9.4
p(t)=0.385190
Std=8.88
p(F)=0.014988
k074.fex.hot.tbl.frex-only.stats

k075.fex.hot.tbl
k075.fex.hot.tbl.frex-only.cdf

k075.fex.hot.tbl.frex-only.cdf
p(KS test)=0.999633.
Npts=4 Median=4
Mean=28.8
p(t)=0.462372
Std=49.5
p(F)=0.000094
k075.fex.hot.tbl.frex-only.stats

k076.fex.hot.tbl
k076.fex.hot.tbl.frex-only.cdf

k076.fex.hot.tbl.frex-only.cdf
p(KS test)=0.431256.
Npts=3 Median=12
Mean=9.33
p(t)=0.314212
Std=4.62
p(F)=0.100966
k076.fex.hot.tbl.frex-only.stats

k077.fex.hot.tbl
k077.fex.hot.tbl.frex-only.cdf

k077.fex.hot.tbl.frex-only.cdf
p(KS test)=0.210552.
Npts=4 Median=7
Mean=8.75
p(t)=0.302566
Std=4.99
p(F)=0.078886
k077.fex.hot.tbl.frex-only.stats

k078.fex.hot.tbl
k078.fex.hot.tbl.frex-only.cdf

k078.fex.hot.tbl.frex-only.cdf
p(KS test)=0.999633.
Npts=4 Median=5
Mean=9.75
p(t)=0.462464
Std=10.2
p(F)=0.010360
k078.fex.hot.tbl.frex-only.stats

k079.fex.hot.tbl
k079.fex.hot.tbl.frex-only.cdf

k079.fex.hot.tbl.frex-only.cdf
p(KS test)=0.210552.
Npts=4 Median=8
Mean=8.5
p(t)=0.164685
Std=2.52
p(F)=0.417978
k079.fex.hot.tbl.frex-only.stats

k080.fex.hot.tbl
k080.fex.hot.tbl.frex-only.cdf

k080.fex.hot.tbl.frex-only.cdf
p(KS test)=0.210552.
Npts=4 Median=7
Mean=10.2
p(t)=0.310163
Std=7.18
p(F)=0.028645
k080.fex.hot.tbl.frex-only.stats

k093.fex.hot.tbl
k093.fex.hot.tbl.frex-only.cdf

k093.fex.hot.tbl.frex-only.cdf
p(KS test)=0.927221.
Npts=3 Median=5
Mean=5
p(t)=0.829763
Std=1
p(F)=0.644893
k093.fex.hot.tbl.frex-only.stats

k094.fex.hot.tbl
k094.fex.hot.tbl.frex-only.cdf

k094.fex.hot.tbl.frex-only.cdf
p(KS test)=0.999924.
Npts=3 Median=4
Mean=4
p(t)=0.476804
Std=0
p(F)=0.000000
k094.fex.hot.tbl.frex-only.stats

k095.fex.hot.tbl
k095.fex.hot.tbl.frex-only.cdf

k095.fex.hot.tbl.frex-only.cdf
p(KS test)=0.210552.
Npts=4 Median=7
Mean=8.75
p(t)=0.314084
Std=5.19
p(F)=0.071041
k095.fex.hot.tbl.frex-only.stats

k096.fex.hot.tbl
k096.fex.hot.tbl.frex-only.cdf

k096.fex.hot.tbl.frex-only.cdf
p(KS test)=1.000000.
Npts=3 Median=4
Mean=5
p(t)=0.869967
Std=1.73
p(F)=0.770407
k096.fex.hot.tbl.frex-only.stats

k097.fex.hot.tbl
k097.fex.hot.tbl.frex-only.cdf

k097.fex.hot.tbl.frex-only.cdf
p(KS test)=0.999992.
Npts=5 Median=4
Mean=5.4
p(t)=0.691974
Std=2.61
p(F)=0.390389
k097.fex.hot.tbl.frex-only.stats

k099.fex.hot.tbl
k099.fex.hot.tbl.frex-only.cdf

k099.fex.hot.tbl.frex-only.cdf
p(KS test)=0.999633.
Npts=4 Median=4
Mean=4.25
p(t)=0.609729
Std=0.5
p(F)=0.104088
k099.fex.hot.tbl.frex-only.stats


Last update: 25-Aug-97 (10:37:9), Joe Mazzarella (mazz@ipac.caltech.edu )