
Tabular Data
OR mask in Fowler's Format
FITS Image

Tabular Data
OR mask in Fowler's Format
FITS Image
Tabular Data
OR mask in Fowler's Format
FITS Image

k.scan_cnt.tbl
h.scan_cnt.tbl

j.scan_cnt.tbl
3 scans (in low density regions) identified for analysis:
s021 s022 s024
Procedures performed are outlined in Data Processing
| K | H | J | |
| 1) Sum of FREX Images: |  Tabular Data OR mask in Fowler's Format FITS Image |
 Tabular Data OR mask in Fowler's Format FITS Image |
 Tabular Data OR mask in Fowler's Format FITS Image |
| 2) Scan Counts: |  k.scan_cnt.tbl |
 h.scan_cnt.tbl |
 j.scan_cnt.tbl |
| Histogram cdf data file | CDF cdf data file p(KS test) |
# Points | Median Mean p(t) | Std p(F) | Statistics file |
 k.fex.stack.hot.tbl k.fex.stack.hot.tbl.frex-only.cdf |
 k.fex.stack.hot.tbl.frex-only.cdf p(KS test)=0.000000. |
Npts=3 | Median=5 Mean=8.33 p(t)=1.000000 |
Std=6.66 p(F)=1.000000 |
k.fex.stack.hot.tbl.frex-only.stats |
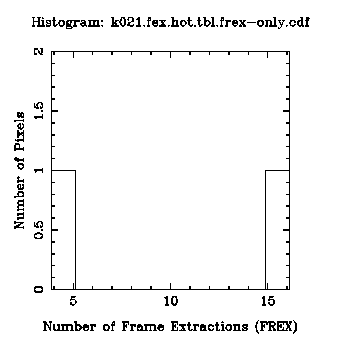 k021.fex.hot.tbl k021.fex.hot.tbl.frex-only.cdf |
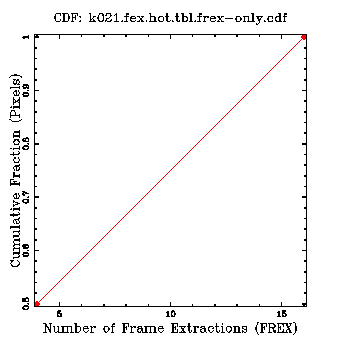 k021.fex.hot.tbl.frex-only.cdf p(KS test)=0.000000. |
Npts=2 | Median=10 Mean=10 p(t)=1.000000 |
Std=8.49 p(F)=1.000000 |
k021.fex.hot.tbl.frex-only.stats |
 k022.fex.hot.tbl k022.fex.hot.tbl.frex-only.cdf |
 k022.fex.hot.tbl.frex-only.cdf p(KS test)= |
Npts= | Median= Mean= p(t)= |
Std= p(F)= |
k022.fex.hot.tbl.frex-only.stats |
 k024.fex.hot.tbl k024.fex.hot.tbl.frex-only.cdf |
 k024.fex.hot.tbl.frex-only.cdf p(KS test)= |
Npts= | Median= Mean= p(t)= |
Std= p(F)= |
k024.fex.hot.tbl.frex-only.stats |