Hot Pixel Analysis--- 970521n

NOTE: DO NOT EDIT THIS FILE! It is generated dynamically by software.
Night/hemisphere dataset: 970521n

20 scans (in low density regions) identified for analysis:
s013 s014 s015 s016 s017 s018 s019 s020 s021 s022 s048 s049 s050 s051 s064 s065 s066 s067 s068 s069

Procedures performed are outlined in Data Processing

Results

Figure 1---
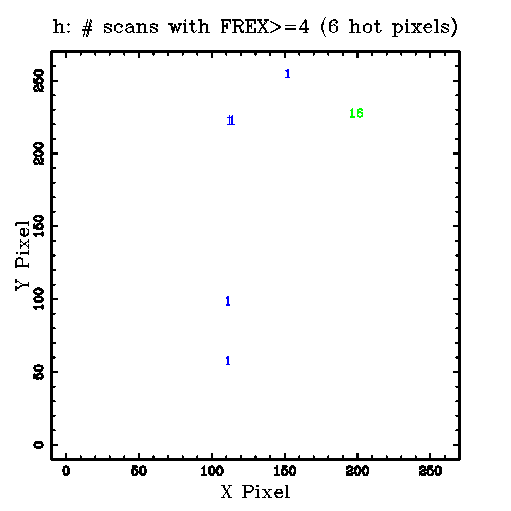
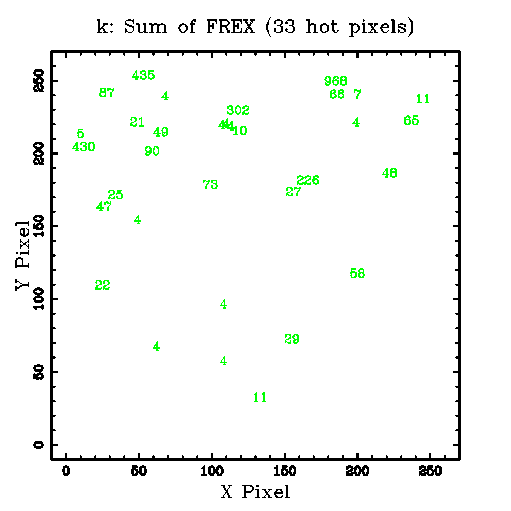
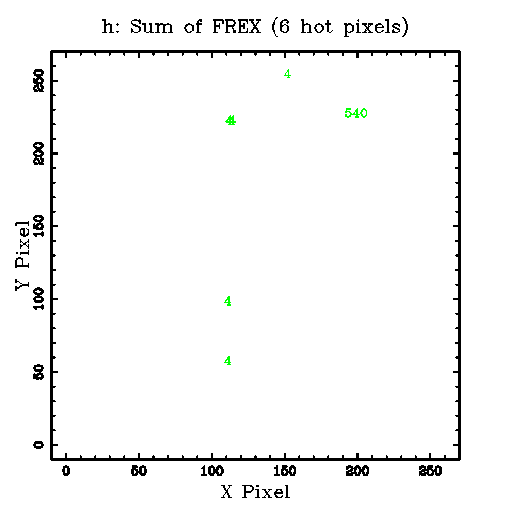
Row 1: The sum (coadd=stack) of 20 FREX (>=4) images. The plotted numbers indicate the sum of the FREX values at each pixel. Links to the FITS images are given below the K, H and J panel.
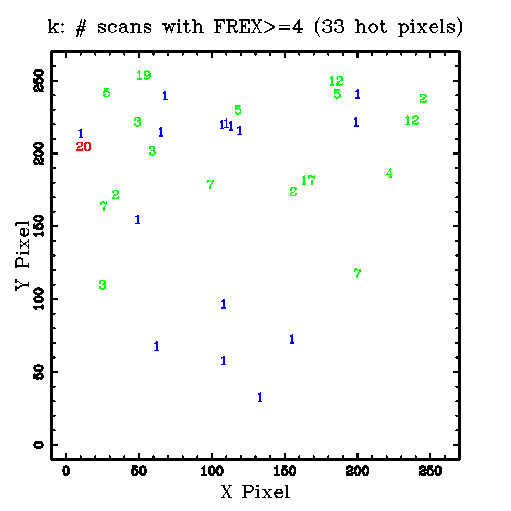
Row 2: The plotted numbers indicate the number of scans (1-20) in which FREX>=4 was found for each hot pixel.
Below the K, H and J panel are links to the corresponding tabular data.

K H J
1) Sum of FREX Images:
Tabular Data
OR mask in Fowler's Format
FITS Image
Tabular Data
OR mask in Fowler's Format
FITS Image
Tabular Data
OR mask in Fowler's Format
FITS Image
2) Scan Counts:
k.scan_cnt.tbl

h.scan_cnt.tbl

j.scan_cnt.tbl


Figure 2---
Histograms, CDFs, and comparison statistics for K-array FREX distributions.

Row 1: Data for the coadd (stack=sum) of 20 FREX (>=4) images.
Following 20 rows: Data for each scan.
Under each CDF plot is a link to the data file, and the p-level for the two-sample KS statistic. After the histogram and CFD plot are rows listing the number of points, median, mean, p-level for the Student's t test for different means, standard deviation, p-level for the F test for different variances, and a link to the original statistics program output file.

Histogram
cdf data file
CDF
cdf data file
p(KS test)
# PointsMedian
Mean
p(t)
Std
p(F)
Statistics file

k.fex.stack.hot.tbl
k.fex.stack.hot.tbl.frex-only.cdf

k.fex.stack.hot.tbl.frex-only.cdf
p(KS test)=0.000000.
Npts=33 Median=25
Mean=95.4
p(t)=1.000000
Std=193
p(F)=1.000000
k.fex.stack.hot.tbl.frex-only.stats

k013.fex.hot.tbl
k013.fex.hot.tbl.frex-only.cdf

k013.fex.hot.tbl.frex-only.cdf
p(KS test)=0.000000.
Npts=11 Median=12
Mean=30.9
p(t)=1.000000
Std=40.9
p(F)=1.000000
k013.fex.hot.tbl.frex-only.stats

k014.fex.hot.tbl
k014.fex.hot.tbl.frex-only.cdf

k014.fex.hot.tbl.frex-only.cdf
p(KS test)=0.695840.
Npts=8 Median=13
Mean=22.6
p(t)=0.611198
Std=24.6
p(F)=0.190836
k014.fex.hot.tbl.frex-only.stats

k015.fex.hot.tbl
k015.fex.hot.tbl.frex-only.cdf

k015.fex.hot.tbl.frex-only.cdf
p(KS test)=0.358529.
Npts=6 Median=6
Mean=9.5
p(t)=0.185563
Std=9.09
p(F)=0.003974
k015.fex.hot.tbl.frex-only.stats

k016.fex.hot.tbl
k016.fex.hot.tbl.frex-only.cdf

k016.fex.hot.tbl.frex-only.cdf
p(KS test)=0.881090.
Npts=8 Median=12
Mean=28.5
p(t)=0.904586
Std=40.6
p(F)=0.983250
k016.fex.hot.tbl.frex-only.stats

k017.fex.hot.tbl
k017.fex.hot.tbl.frex-only.cdf

k017.fex.hot.tbl.frex-only.cdf
p(KS test)=0.992671.
Npts=7 Median=8
Mean=14.4
p(t)=0.282844
Std=12.2
p(F)=0.007959
k017.fex.hot.tbl.frex-only.stats

k018.fex.hot.tbl
k018.fex.hot.tbl.frex-only.cdf

k018.fex.hot.tbl.frex-only.cdf
p(KS test)=0.994861.
Npts=6 Median=19
Mean=17.2
p(t)=0.364926
Std=11.1
p(F)=0.009992
k018.fex.hot.tbl.frex-only.stats

k019.fex.hot.tbl
k019.fex.hot.tbl.frex-only.cdf

k019.fex.hot.tbl.frex-only.cdf
p(KS test)=0.910512.
Npts=10 Median=8.5
Mean=14.3
p(t)=0.259475
Std=12.8
p(F)=0.001810
k019.fex.hot.tbl.frex-only.stats

k020.fex.hot.tbl
k020.fex.hot.tbl.frex-only.cdf

k020.fex.hot.tbl.frex-only.cdf
p(KS test)=0.990216.
Npts=8 Median=10
Mean=24.1
p(t)=0.704281
Std=31.8
p(F)=0.517392
k020.fex.hot.tbl.frex-only.stats

k021.fex.hot.tbl
k021.fex.hot.tbl.frex-only.cdf

k021.fex.hot.tbl.frex-only.cdf
p(KS test)=0.990216.
Npts=8 Median=11.5
Mean=23.8
p(t)=0.688999
Std=31.7
p(F)=0.516245
k021.fex.hot.tbl.frex-only.stats

k022.fex.hot.tbl
k022.fex.hot.tbl.frex-only.cdf

k022.fex.hot.tbl.frex-only.cdf
p(KS test)=0.461071.
Npts=11 Median=10
Mean=12.6
p(t)=0.203729
Std=7.06
p(F)=0.000005
k022.fex.hot.tbl.frex-only.stats

k048.fex.hot.tbl
k048.fex.hot.tbl.frex-only.cdf

k048.fex.hot.tbl.frex-only.cdf
p(KS test)=0.994861.
Npts=6 Median=16
Mean=29.7
p(t)=0.956690
Std=42.4
p(F)=0.857936
k048.fex.hot.tbl.frex-only.stats

k049.fex.hot.tbl
k049.fex.hot.tbl.frex-only.cdf

k049.fex.hot.tbl.frex-only.cdf
p(KS test)=0.848844.
Npts=8 Median=12
Mean=15.4
p(t)=0.301369
Std=13
p(F)=0.006210
k049.fex.hot.tbl.frex-only.stats

k050.fex.hot.tbl
k050.fex.hot.tbl.frex-only.cdf

k050.fex.hot.tbl.frex-only.cdf
p(KS test)=0.736429.
Npts=8 Median=25
Mean=26.6
p(t)=0.776152
Std=19.5
p(F)=0.061207
k050.fex.hot.tbl.frex-only.stats

k051.fex.hot.tbl
k051.fex.hot.tbl.frex-only.cdf

k051.fex.hot.tbl.frex-only.cdf
p(KS test)=0.613499.
Npts=8 Median=5
Mean=12
p(t)=0.217400
Std=11.7
p(F)=0.003151
k051.fex.hot.tbl.frex-only.stats

k064.fex.hot.tbl
k064.fex.hot.tbl.frex-only.cdf

k064.fex.hot.tbl.frex-only.cdf
p(KS test)=0.999960.
Npts=8 Median=12.5
Mean=25.8
p(t)=0.782995
Std=35.3
p(F)=0.720109
k064.fex.hot.tbl.frex-only.stats

k065.fex.hot.tbl
k065.fex.hot.tbl.frex-only.cdf

k065.fex.hot.tbl.frex-only.cdf
p(KS test)=0.339759.
Npts=7 Median=8
Mean=10
p(t)=0.174656
Std=5.72
p(F)=0.000106
k065.fex.hot.tbl.frex-only.stats

k066.fex.hot.tbl
k066.fex.hot.tbl.frex-only.cdf

k066.fex.hot.tbl.frex-only.cdf
p(KS test)=0.753643.
Npts=5 Median=8
Mean=10.2
p(t)=0.207149
Std=7.29
p(F)=0.004594
k066.fex.hot.tbl.frex-only.stats

k067.fex.hot.tbl
k067.fex.hot.tbl.frex-only.cdf

k067.fex.hot.tbl.frex-only.cdf
p(KS test)=0.855180.
Npts=5 Median=25
Mean=24.8
p(t)=0.705190
Std=17.5
p(F)=0.117439
k067.fex.hot.tbl.frex-only.stats

k068.fex.hot.tbl
k068.fex.hot.tbl.frex-only.cdf

k068.fex.hot.tbl.frex-only.cdf
p(KS test)=0.907988.
Npts=7 Median=10
Mean=29.6
p(t)=0.943259
Std=33.2
p(F)=0.633205
k068.fex.hot.tbl.frex-only.stats

k069.fex.hot.tbl
k069.fex.hot.tbl.frex-only.cdf

k069.fex.hot.tbl.frex-only.cdf
p(KS test)=0.979125.
Npts=5 Median=21
Mean=41
p(t)=0.693251
Std=43.7
p(F)=0.780480
k069.fex.hot.tbl.frex-only.stats


Last update: 6-Jun-97 (7:8:27), Joe Mazzarella (mazz@ipac.caltech.edu )