Hot Pixel Analysis--- 970603n

NOTE: DO NOT EDIT THIS FILE! It is generated dynamically by software.
Night/hemisphere dataset: 970603n

41 scans (in low density regions) identified for analysis:
s006 s007 s008 s009 s010 s011 s012 s013 s014 s015 s016 s017 s032 s033 s034 s035 s036 s037 s038 s039 s040 s041 s042 s043 s064 s065 s066 s067 s068 s069 s084 s085 s086 s087 s088 s116 s117 s118 s119 s120 s121

Procedures performed are outlined in Data Processing

Results

Figure 1---
Row 1: The sum (coadd=stack) of 41 FREX (>=4) images. The plotted numbers indicate the sum of the FREX values at each pixel. Links to the FITS images are given below the K, H and J panel.
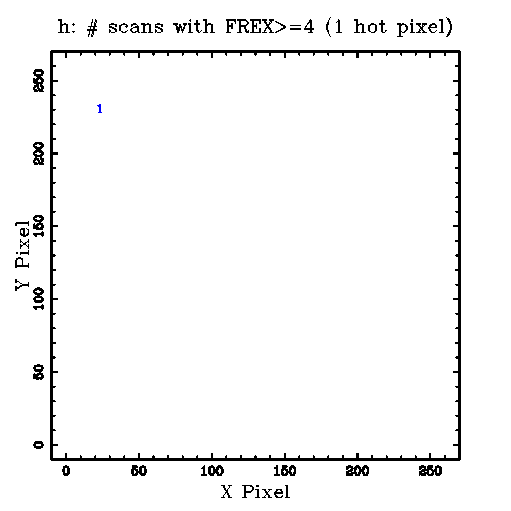
Row 2: The plotted numbers indicate the number of scans (1-41) in which FREX>=4 was found for each hot pixel.
Below the K, H and J panel are links to the corresponding tabular data.

K H J
1) Sum of FREX Images:
Tabular Data
OR mask in Fowler's Format
FITS Image

Tabular Data
OR mask in Fowler's Format
FITS Image
Tabular Data
OR mask in Fowler's Format
FITS Image
2) Scan Counts:
k.scan_cnt.tbl

h.scan_cnt.tbl

j.scan_cnt.tbl


Figure 2---
Histograms, CDFs, and comparison statistics for K-array FREX distributions.

Row 1: Data for the coadd (stack=sum) of 41 FREX (>=4) images.
Following 41 rows: Data for each scan.
Under each CDF plot is a link to the data file, and the p-level for the two-sample KS statistic. After the histogram and CFD plot are rows listing the number of points, median, mean, p-level for the Student's t test for different means, standard deviation, p-level for the F test for different variances, and a link to the original statistics program output file.

Histogram
cdf data file
CDF
cdf data file
p(KS test)
# PointsMedian
Mean
p(t)
Std
p(F)
Statistics file

k.fex.stack.hot.tbl
k.fex.stack.hot.tbl.frex-only.cdf

k.fex.stack.hot.tbl.frex-only.cdf
p(KS test)=0.000000.
Npts=24 Median=12.5
Mean=34.6
p(t)=1.000000
Std=50.5
p(F)=1.000000
k.fex.stack.hot.tbl.frex-only.stats

k006.fex.hot.tbl
k006.fex.hot.tbl.frex-only.cdf

k006.fex.hot.tbl.frex-only.cdf
p(KS test)=0.000000.
Npts=3 Median=17
Mean=14.3
p(t)=1.000000
Std=6.43
p(F)=1.000000
k006.fex.hot.tbl.frex-only.stats

k007.fex.hot.tbl
k007.fex.hot.tbl.frex-only.cdf

k007.fex.hot.tbl.frex-only.cdf
p(KS test)=
Npts= Median=
Mean=
p(t)=
Std=
p(F)=
k007.fex.hot.tbl.frex-only.stats

k008.fex.hot.tbl
k008.fex.hot.tbl.frex-only.cdf

k008.fex.hot.tbl.frex-only.cdf
p(KS test)=0.181300.
Npts=2 Median=4.5
Mean=4.5
p(t)=0.321080
Std=0.707
p(F)=0.155074
k008.fex.hot.tbl.frex-only.stats

k009.fex.hot.tbl
k009.fex.hot.tbl.frex-only.cdf

k009.fex.hot.tbl.frex-only.cdf
p(KS test)=
Npts= Median=
Mean=
p(t)=
Std=
p(F)=
k009.fex.hot.tbl.frex-only.stats

k010.fex.hot.tbl
k010.fex.hot.tbl.frex-only.cdf

k010.fex.hot.tbl.frex-only.cdf
p(KS test)=
Npts= Median=
Mean=
p(t)=
Std=
p(F)=
k010.fex.hot.tbl.frex-only.stats

k011.fex.hot.tbl
k011.fex.hot.tbl.frex-only.cdf

k011.fex.hot.tbl.frex-only.cdf
p(KS test)=
Npts= Median=
Mean=
p(t)=
Std=
p(F)=
k011.fex.hot.tbl.frex-only.stats

k012.fex.hot.tbl
k012.fex.hot.tbl.frex-only.cdf

k012.fex.hot.tbl.frex-only.cdf
p(KS test)=0.509458.
Npts=5 Median=6
Mean=10
p(t)=0.506054
Std=7.11
p(F)=0.992930
k012.fex.hot.tbl.frex-only.stats

k013.fex.hot.tbl
k013.fex.hot.tbl.frex-only.cdf

k013.fex.hot.tbl.frex-only.cdf
p(KS test)=0.099562.
Npts=3 Median=5
Mean=5
p(t)=0.243598
Std=1
p(F)=0.047244
k013.fex.hot.tbl.frex-only.stats

k014.fex.hot.tbl
k014.fex.hot.tbl.frex-only.cdf

k014.fex.hot.tbl.frex-only.cdf
p(KS test)=0.181300.
Npts=2 Median=5
Mean=5
p(t)=0.337209
Std=1.41
p(F)=0.307389
k014.fex.hot.tbl.frex-only.stats

k015.fex.hot.tbl
k015.fex.hot.tbl.frex-only.cdf

k015.fex.hot.tbl.frex-only.cdf
p(KS test)=
Npts= Median=
Mean=
p(t)=
Std=
p(F)=
k015.fex.hot.tbl.frex-only.stats

k016.fex.hot.tbl
k016.fex.hot.tbl.frex-only.cdf

k016.fex.hot.tbl.frex-only.cdf
p(KS test)=
Npts= Median=
Mean=
p(t)=
Std=
p(F)=
k016.fex.hot.tbl.frex-only.stats

k017.fex.hot.tbl
k017.fex.hot.tbl.frex-only.cdf

k017.fex.hot.tbl.frex-only.cdf
p(KS test)=0.784770.
Npts=4 Median=6
Mean=8.5
p(t)=0.403979
Std=5.74
p(F)=0.804581
k017.fex.hot.tbl.frex-only.stats

k032.fex.hot.tbl
k032.fex.hot.tbl.frex-only.cdf

k032.fex.hot.tbl.frex-only.cdf
p(KS test)=0.375207.
Npts=5 Median=10
Mean=8
p(t)=0.314997
Std=3.67
p(F)=0.312243
k032.fex.hot.tbl.frex-only.stats

k033.fex.hot.tbl
k033.fex.hot.tbl.frex-only.cdf

k033.fex.hot.tbl.frex-only.cdf
p(KS test)=0.996255.
Npts=3 Median=17
Mean=17.7
p(t)=0.652999
Std=7.02
p(F)=0.911765
k033.fex.hot.tbl.frex-only.stats

k034.fex.hot.tbl
k034.fex.hot.tbl.frex-only.cdf

k034.fex.hot.tbl.frex-only.cdf
p(KS test)=0.996255.
Npts=3 Median=14
Mean=12.7
p(t)=0.813571
Std=7.09
p(F)=0.901818
k034.fex.hot.tbl.frex-only.stats

k035.fex.hot.tbl
k035.fex.hot.tbl.frex-only.cdf

k035.fex.hot.tbl.frex-only.cdf
p(KS test)=
Npts= Median=
Mean=
p(t)=
Std=
p(F)=
k035.fex.hot.tbl.frex-only.stats

k036.fex.hot.tbl
k036.fex.hot.tbl.frex-only.cdf

k036.fex.hot.tbl.frex-only.cdf
p(KS test)=0.996255.
Npts=3 Median=10
Mean=11.7
p(t)=0.741759
Std=8.62
p(F)=0.714697
k036.fex.hot.tbl.frex-only.stats

k037.fex.hot.tbl
k037.fex.hot.tbl.frex-only.cdf

k037.fex.hot.tbl.frex-only.cdf
p(KS test)=0.517551.
Npts=3 Median=10
Mean=9
p(t)=0.428756
Std=3.61
p(F)=0.478528
k037.fex.hot.tbl.frex-only.stats

k038.fex.hot.tbl
k038.fex.hot.tbl.frex-only.cdf

k038.fex.hot.tbl.frex-only.cdf
p(KS test)=0.808819.
Npts=5 Median=11
Mean=12.2
p(t)=0.701834
Std=5.72
p(F)=0.750906
k038.fex.hot.tbl.frex-only.stats

k039.fex.hot.tbl
k039.fex.hot.tbl.frex-only.cdf

k039.fex.hot.tbl.frex-only.cdf
p(KS test)=0.517551.
Npts=3 Median=6
Mean=7
p(t)=0.318821
Std=2.65
p(F)=0.289655
k039.fex.hot.tbl.frex-only.stats

k040.fex.hot.tbl
k040.fex.hot.tbl.frex-only.cdf

k040.fex.hot.tbl.frex-only.cdf
p(KS test)=0.925086.
Npts=2 Median=12.5
Mean=12.5
p(t)=0.860776
Std=9.19
p(F)=0.578053
k040.fex.hot.tbl.frex-only.stats

k041.fex.hot.tbl
k041.fex.hot.tbl.frex-only.cdf

k041.fex.hot.tbl.frex-only.cdf
p(KS test)=
Npts= Median=
Mean=
p(t)=
Std=
p(F)=
k041.fex.hot.tbl.frex-only.stats

k042.fex.hot.tbl
k042.fex.hot.tbl.frex-only.cdf

k042.fex.hot.tbl.frex-only.cdf
p(KS test)=
Npts= Median=
Mean=
p(t)=
Std=
p(F)=
k042.fex.hot.tbl.frex-only.stats

k043.fex.hot.tbl
k043.fex.hot.tbl.frex-only.cdf

k043.fex.hot.tbl.frex-only.cdf
p(KS test)=0.660386.
Npts=2 Median=8.5
Mean=8.5
p(t)=0.557703
Std=6.36
p(F)=0.853139
k043.fex.hot.tbl.frex-only.stats

k064.fex.hot.tbl
k064.fex.hot.tbl.frex-only.cdf

k064.fex.hot.tbl.frex-only.cdf
p(KS test)=0.660386.
Npts=2 Median=14
Mean=14
p(t)=0.949665
Std=1.41
p(F)=0.307389
k064.fex.hot.tbl.frex-only.stats

k065.fex.hot.tbl
k065.fex.hot.tbl.frex-only.cdf

k065.fex.hot.tbl.frex-only.cdf
p(KS test)=
Npts= Median=
Mean=
p(t)=
Std=
p(F)=
k065.fex.hot.tbl.frex-only.stats

k066.fex.hot.tbl
k066.fex.hot.tbl.frex-only.cdf

k066.fex.hot.tbl.frex-only.cdf
p(KS test)=
Npts= Median=
Mean=
p(t)=
Std=
p(F)=
k066.fex.hot.tbl.frex-only.stats

k067.fex.hot.tbl
k067.fex.hot.tbl.frex-only.cdf

k067.fex.hot.tbl.frex-only.cdf
p(KS test)=0.660386.
Npts=2 Median=9
Mean=9
p(t)=0.527609
Std=4.24
p(F)=0.845714
k067.fex.hot.tbl.frex-only.stats

k068.fex.hot.tbl
k068.fex.hot.tbl.frex-only.cdf

k068.fex.hot.tbl.frex-only.cdf
p(KS test)=
Npts= Median=
Mean=
p(t)=
Std=
p(F)=
k068.fex.hot.tbl.frex-only.stats

k069.fex.hot.tbl
k069.fex.hot.tbl.frex-only.cdf

k069.fex.hot.tbl.frex-only.cdf
p(KS test)=
Npts= Median=
Mean=
p(t)=
Std=
p(F)=
k069.fex.hot.tbl.frex-only.stats

k084.fex.hot.tbl
k084.fex.hot.tbl.frex-only.cdf

k084.fex.hot.tbl.frex-only.cdf
p(KS test)=0.509458.
Npts=5 Median=6
Mean=10.4
p(t)=0.536823
Std=6.99
p(F)=0.986999
k084.fex.hot.tbl.frex-only.stats

k085.fex.hot.tbl
k085.fex.hot.tbl.frex-only.cdf

k085.fex.hot.tbl.frex-only.cdf
p(KS test)=0.517551.
Npts=3 Median=5
Mean=6
p(t)=0.285760
Std=2.65
p(F)=0.289655
k085.fex.hot.tbl.frex-only.stats

k086.fex.hot.tbl
k086.fex.hot.tbl.frex-only.cdf

k086.fex.hot.tbl.frex-only.cdf
p(KS test)=
Npts= Median=
Mean=
p(t)=
Std=
p(F)=
k086.fex.hot.tbl.frex-only.stats

k087.fex.hot.tbl
k087.fex.hot.tbl.frex-only.cdf

k087.fex.hot.tbl.frex-only.cdf
p(KS test)=0.660386.
Npts=2 Median=9
Mean=9
p(t)=0.494389
Std=2.83
p(F)=0.594089
k087.fex.hot.tbl.frex-only.stats

k088.fex.hot.tbl
k088.fex.hot.tbl.frex-only.cdf

k088.fex.hot.tbl.frex-only.cdf
p(KS test)=
Npts= Median=
Mean=
p(t)=
Std=
p(F)=
k088.fex.hot.tbl.frex-only.stats

k116.fex.hot.tbl
k116.fex.hot.tbl.frex-only.cdf

k116.fex.hot.tbl.frex-only.cdf
p(KS test)=0.660386.
Npts=2 Median=8.5
Mean=8.5
p(t)=0.457366
Std=2.12
p(F)=0.454424
k116.fex.hot.tbl.frex-only.stats

k117.fex.hot.tbl
k117.fex.hot.tbl.frex-only.cdf

k117.fex.hot.tbl.frex-only.cdf
p(KS test)=0.375207.
Npts=5 Median=5
Mean=6.8
p(t)=0.260538
Std=3.42
p(F)=0.261340
k117.fex.hot.tbl.frex-only.stats

k118.fex.hot.tbl
k118.fex.hot.tbl.frex-only.cdf

k118.fex.hot.tbl.frex-only.cdf
p(KS test)=0.660386.
Npts=2 Median=8
Mean=8
p(t)=0.426310
Std=1.41
p(F)=0.307389
k118.fex.hot.tbl.frex-only.stats

k119.fex.hot.tbl
k119.fex.hot.tbl.frex-only.cdf

k119.fex.hot.tbl.frex-only.cdf
p(KS test)=0.289819.
Npts=4 Median=5
Mean=5.5
p(t)=0.220603
Std=1
p(F)=0.013107
k119.fex.hot.tbl.frex-only.stats

k120.fex.hot.tbl
k120.fex.hot.tbl.frex-only.cdf

k120.fex.hot.tbl.frex-only.cdf
p(KS test)=
Npts= Median=
Mean=
p(t)=
Std=
p(F)=
k120.fex.hot.tbl.frex-only.stats

k121.fex.hot.tbl
k121.fex.hot.tbl.frex-only.cdf

k121.fex.hot.tbl.frex-only.cdf
p(KS test)=0.660386.
Npts=2 Median=12.5
Mean=12.5
p(t)=0.753305
Std=2.12
p(F)=0.454424
k121.fex.hot.tbl.frex-only.stats


Last update: 26-Aug-97 (8:15:17), Joe Mazzarella (mazz@ipac.caltech.edu )