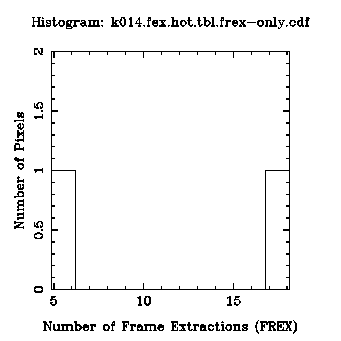
Tabular Data
OR mask in Fowler's Format
FITS Image
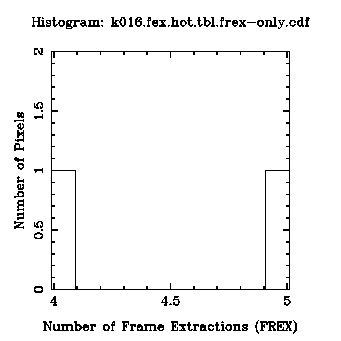
Tabular Data
OR mask in Fowler's Format
FITS Image

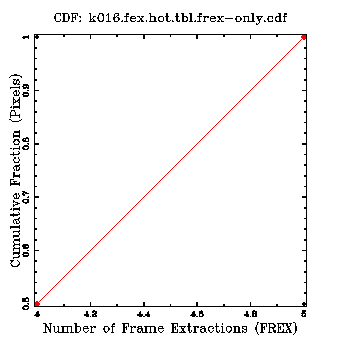
Tabular Data
OR mask in Fowler's Format
FITS Image
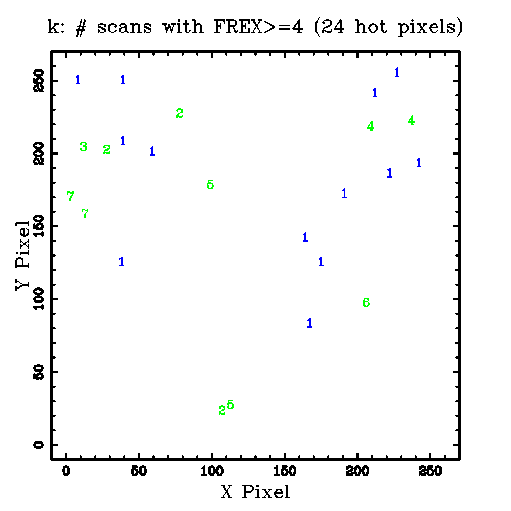
k.scan_cnt.tbl

h.scan_cnt.tbl
j.scan_cnt.tbl
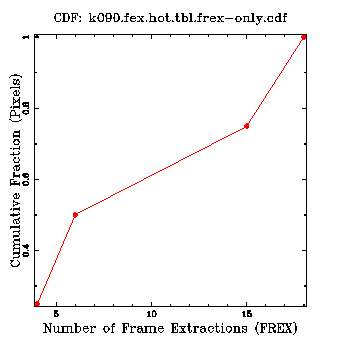
29 scans (in low density regions) identified for analysis:
s006 s008 s012 s013 s014 s015 s016 s017 s032 s033 s034 s035 s036 s037 s040 s043 s089 s090 s091 s092 s093 s094 s095 s116 s117 s118 s119 s120 s121
Procedures performed are outlined in Data Processing
| K | H | J | |
| 1) Sum of FREX Images: | Tabular Data OR mask in Fowler's Format FITS Image |
Tabular Data OR mask in Fowler's Format FITS Image |
Tabular Data OR mask in Fowler's Format FITS Image |
| 2) Scan Counts: | k.scan_cnt.tbl |
h.scan_cnt.tbl |
j.scan_cnt.tbl |