Hot Pixel Analysis--- 970619n

NOTE: DO NOT EDIT THIS FILE! It is generated dynamically by software.
Night/hemisphere dataset: 970619n

42 scans (in low density regions) identified for analysis:
s008 s009 s010 s011 s012 s013 s014 s015 s016 s017 s018 s019 s034 s035 s036 s037 s038 s039 s040 s041 s042 s043 s044 s045 s060 s061 s062 s063 s064 s065 s066 s067 s068 s069 s070 s071 s111 s112 s113 s114 s115 s116

Procedures performed are outlined in Data Processing

Results

Figure 1---
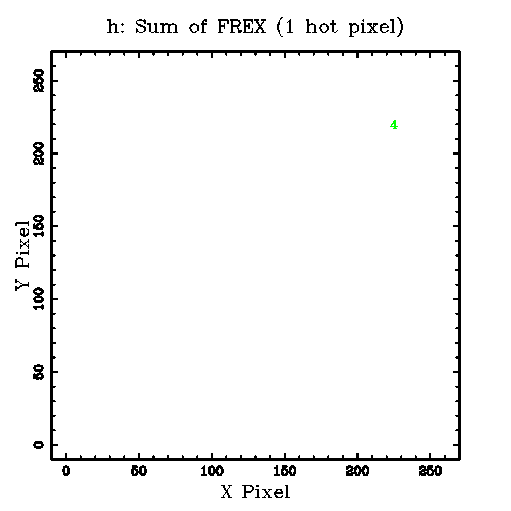
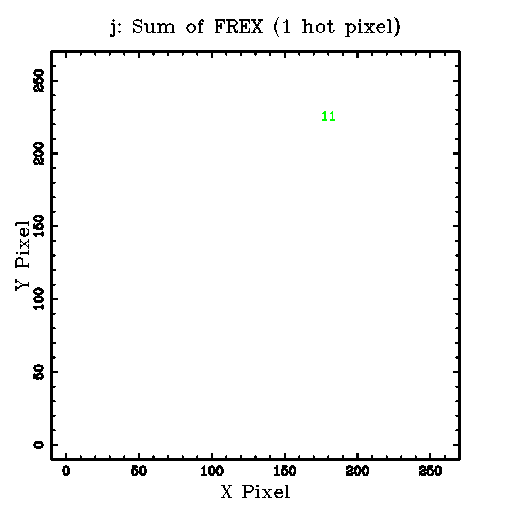
Row 1: The sum (coadd=stack) of 42 FREX (>=4) images. The plotted numbers indicate the sum of the FREX values at each pixel. Links to the FITS images are given below the K, H and J panel.
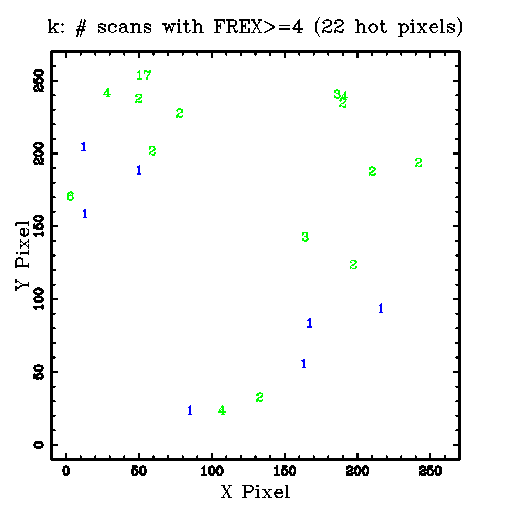
Row 2: The plotted numbers indicate the number of scans (1-42) in which FREX>=4 was found for each hot pixel.
Below the K, H and J panel are links to the corresponding tabular data.

K H J
1) Sum of FREX Images:
Tabular Data
OR mask in Fowler's Format
FITS Image
Tabular Data
OR mask in Fowler's Format
FITS Image
Tabular Data
OR mask in Fowler's Format
FITS Image
2) Scan Counts:
k.scan_cnt.tbl

h.scan_cnt.tbl

j.scan_cnt.tbl


Figure 2---
Histograms, CDFs, and comparison statistics for K-array FREX distributions.

Row 1: Data for the coadd (stack=sum) of 42 FREX (>=4) images.
Following 42 rows: Data for each scan.
Under each CDF plot is a link to the data file, and the p-level for the two-sample KS statistic. After the histogram and CFD plot are rows listing the number of points, median, mean, p-level for the Student's t test for different means, standard deviation, p-level for the F test for different variances, and a link to the original statistics program output file.

Histogram
cdf data file
CDF
cdf data file
p(KS test)
# PointsMedian
Mean
p(t)
Std
p(F)
Statistics file

k.fex.stack.hot.tbl
k.fex.stack.hot.tbl.frex-only.cdf

k.fex.stack.hot.tbl.frex-only.cdf
p(KS test)=0.000000.
Npts=22 Median=17.5
Mean=24.8
p(t)=1.000000
Std=27
p(F)=1.000000
k.fex.stack.hot.tbl.frex-only.stats

k008.fex.hot.tbl
k008.fex.hot.tbl.frex-only.cdf

k008.fex.hot.tbl.frex-only.cdf
p(KS test)=0.000000.
Npts=2 Median=7.5
Mean=7.5
p(t)=1.000000
Std=2.12
p(F)=1.000000
k008.fex.hot.tbl.frex-only.stats

k009.fex.hot.tbl
k009.fex.hot.tbl.frex-only.cdf

k009.fex.hot.tbl.frex-only.cdf
p(KS test)=
Npts= Median=
Mean=
p(t)=
Std=
p(F)=
k009.fex.hot.tbl.frex-only.stats

k010.fex.hot.tbl
k010.fex.hot.tbl.frex-only.cdf

k010.fex.hot.tbl.frex-only.cdf
p(KS test)=0.963945.
Npts=2 Median=7
Mean=7
p(t)=0.855741
Std=1.41
p(F)=0.748668
k010.fex.hot.tbl.frex-only.stats

k011.fex.hot.tbl
k011.fex.hot.tbl.frex-only.cdf

k011.fex.hot.tbl.frex-only.cdf
p(KS test)=
Npts= Median=
Mean=
p(t)=
Std=
p(F)=
k011.fex.hot.tbl.frex-only.stats

k012.fex.hot.tbl
k012.fex.hot.tbl.frex-only.cdf

k012.fex.hot.tbl.frex-only.cdf
p(KS test)=
Npts= Median=
Mean=
p(t)=
Std=
p(F)=
k012.fex.hot.tbl.frex-only.stats

k013.fex.hot.tbl
k013.fex.hot.tbl.frex-only.cdf

k013.fex.hot.tbl.frex-only.cdf
p(KS test)=0.963945.
Npts=2 Median=9
Mean=9
p(t)=0.719485
Std=2.83
p(F)=0.819331
k013.fex.hot.tbl.frex-only.stats

k014.fex.hot.tbl
k014.fex.hot.tbl.frex-only.cdf

k014.fex.hot.tbl.frex-only.cdf
p(KS test)=
Npts= Median=
Mean=
p(t)=
Std=
p(F)=
k014.fex.hot.tbl.frex-only.stats

k015.fex.hot.tbl
k015.fex.hot.tbl.frex-only.cdf

k015.fex.hot.tbl.frex-only.cdf
p(KS test)=0.660386.
Npts=3 Median=4
Mean=5
p(t)=0.470179
Std=1.73
p(F)=0.690693
k015.fex.hot.tbl.frex-only.stats

k016.fex.hot.tbl
k016.fex.hot.tbl.frex-only.cdf

k016.fex.hot.tbl.frex-only.cdf
p(KS test)=0.996255.
Npts=6 Median=7
Mean=9.17
p(t)=0.680513
Std=6.01
p(F)=0.522665
k016.fex.hot.tbl.frex-only.stats

k017.fex.hot.tbl
k017.fex.hot.tbl.frex-only.cdf

k017.fex.hot.tbl.frex-only.cdf
p(KS test)=0.925086.
Npts=3 Median=8
Mean=8.67
p(t)=0.648902
Std=1.15
p(F)=0.415188
k017.fex.hot.tbl.frex-only.stats

k018.fex.hot.tbl
k018.fex.hot.tbl.frex-only.cdf

k018.fex.hot.tbl.frex-only.cdf
p(KS test)=
Npts= Median=
Mean=
p(t)=
Std=
p(F)=
k018.fex.hot.tbl.frex-only.stats

k019.fex.hot.tbl
k019.fex.hot.tbl.frex-only.cdf

k019.fex.hot.tbl.frex-only.cdf
p(KS test)=
Npts= Median=
Mean=
p(t)=
Std=
p(F)=
k019.fex.hot.tbl.frex-only.stats

k034.fex.hot.tbl
k034.fex.hot.tbl.frex-only.cdf

k034.fex.hot.tbl.frex-only.cdf
p(KS test)=
Npts= Median=
Mean=
p(t)=
Std=
p(F)=
k034.fex.hot.tbl.frex-only.stats

k035.fex.hot.tbl
k035.fex.hot.tbl.frex-only.cdf

k035.fex.hot.tbl.frex-only.cdf
p(KS test)=
Npts= Median=
Mean=
p(t)=
Std=
p(F)=
k035.fex.hot.tbl.frex-only.stats

k036.fex.hot.tbl
k036.fex.hot.tbl.frex-only.cdf

k036.fex.hot.tbl.frex-only.cdf
p(KS test)=
Npts= Median=
Mean=
p(t)=
Std=
p(F)=
k036.fex.hot.tbl.frex-only.stats

k037.fex.hot.tbl
k037.fex.hot.tbl.frex-only.cdf

k037.fex.hot.tbl.frex-only.cdf
p(KS test)=0.660386.
Npts=3 Median=4
Mean=5
p(t)=0.470179
Std=1.73
p(F)=0.690693
k037.fex.hot.tbl.frex-only.stats

k038.fex.hot.tbl
k038.fex.hot.tbl.frex-only.cdf

k038.fex.hot.tbl.frex-only.cdf
p(KS test)=0.963945.
Npts=2 Median=5
Mean=5
p(t)=0.525736
Std=1.41
p(F)=0.748668
k038.fex.hot.tbl.frex-only.stats

k039.fex.hot.tbl
k039.fex.hot.tbl.frex-only.cdf

k039.fex.hot.tbl.frex-only.cdf
p(KS test)=0.963945.
Npts=2 Median=8
Mean=8
p(t)=0.920471
Std=4.24
p(F)=0.590334
k039.fex.hot.tbl.frex-only.stats

k040.fex.hot.tbl
k040.fex.hot.tbl.frex-only.cdf

k040.fex.hot.tbl.frex-only.cdf
p(KS test)=0.660386.
Npts=3 Median=4
Mean=5
p(t)=0.470179
Std=1.73
p(F)=0.690693
k040.fex.hot.tbl.frex-only.stats

k041.fex.hot.tbl
k041.fex.hot.tbl.frex-only.cdf

k041.fex.hot.tbl.frex-only.cdf
p(KS test)=0.660386.
Npts=3 Median=4
Mean=9.33
p(t)=0.815385
Std=9.24
p(F)=0.320561
k041.fex.hot.tbl.frex-only.stats

k042.fex.hot.tbl
k042.fex.hot.tbl.frex-only.cdf

k042.fex.hot.tbl.frex-only.cdf
p(KS test)=0.270000.
Npts=2 Median=14.5
Mean=14.5
p(t)=0.350710
Std=2.12
p(F)=1.000000
k042.fex.hot.tbl.frex-only.stats

k043.fex.hot.tbl
k043.fex.hot.tbl.frex-only.cdf

k043.fex.hot.tbl.frex-only.cdf
p(KS test)=
Npts= Median=
Mean=
p(t)=
Std=
p(F)=
k043.fex.hot.tbl.frex-only.stats

k044.fex.hot.tbl
k044.fex.hot.tbl.frex-only.cdf

k044.fex.hot.tbl.frex-only.cdf
p(KS test)=
Npts= Median=
Mean=
p(t)=
Std=
p(F)=
k044.fex.hot.tbl.frex-only.stats

k045.fex.hot.tbl
k045.fex.hot.tbl.frex-only.cdf

k045.fex.hot.tbl.frex-only.cdf
p(KS test)=0.963945.
Npts=2 Median=6.5
Mean=6.5
p(t)=0.824718
Std=3.54
p(F)=0.688083
k045.fex.hot.tbl.frex-only.stats

k060.fex.hot.tbl
k060.fex.hot.tbl.frex-only.cdf

k060.fex.hot.tbl.frex-only.cdf
p(KS test)=0.963945.
Npts=2 Median=6.5
Mean=6.5
p(t)=0.708026
Std=0.707
p(F)=0.409665
k060.fex.hot.tbl.frex-only.stats

k061.fex.hot.tbl
k061.fex.hot.tbl.frex-only.cdf

k061.fex.hot.tbl.frex-only.cdf
p(KS test)=
Npts= Median=
Mean=
p(t)=
Std=
p(F)=
k061.fex.hot.tbl.frex-only.stats

k062.fex.hot.tbl
k062.fex.hot.tbl.frex-only.cdf

k062.fex.hot.tbl.frex-only.cdf
p(KS test)=0.963945.
Npts=2 Median=5.5
Mean=5.5
p(t)=0.616172
Std=2.12
p(F)=1.000000
k062.fex.hot.tbl.frex-only.stats

k063.fex.hot.tbl
k063.fex.hot.tbl.frex-only.cdf

k063.fex.hot.tbl.frex-only.cdf
p(KS test)=0.963945.
Npts=2 Median=9
Mean=9
p(t)=0.850915
Std=7.07
p(F)=0.371094
k063.fex.hot.tbl.frex-only.stats

k064.fex.hot.tbl
k064.fex.hot.tbl.frex-only.cdf

k064.fex.hot.tbl.frex-only.cdf
p(KS test)=
Npts= Median=
Mean=
p(t)=
Std=
p(F)=
k064.fex.hot.tbl.frex-only.stats

k065.fex.hot.tbl
k065.fex.hot.tbl.frex-only.cdf

k065.fex.hot.tbl.frex-only.cdf
p(KS test)=
Npts= Median=
Mean=
p(t)=
Std=
p(F)=
k065.fex.hot.tbl.frex-only.stats

k066.fex.hot.tbl
k066.fex.hot.tbl.frex-only.cdf

k066.fex.hot.tbl.frex-only.cdf
p(KS test)=
Npts= Median=
Mean=
p(t)=
Std=
p(F)=
k066.fex.hot.tbl.frex-only.stats

k067.fex.hot.tbl
k067.fex.hot.tbl.frex-only.cdf

k067.fex.hot.tbl.frex-only.cdf
p(KS test)=
Npts= Median=
Mean=
p(t)=
Std=
p(F)=
k067.fex.hot.tbl.frex-only.stats

k068.fex.hot.tbl
k068.fex.hot.tbl.frex-only.cdf

k068.fex.hot.tbl.frex-only.cdf
p(KS test)=
Npts= Median=
Mean=
p(t)=
Std=
p(F)=
k068.fex.hot.tbl.frex-only.stats

k069.fex.hot.tbl
k069.fex.hot.tbl.frex-only.cdf

k069.fex.hot.tbl.frex-only.cdf
p(KS test)=0.963945.
Npts=2 Median=8.5
Mean=8.5
p(t)=0.888710
Std=6.36
p(F)=0.409665
k069.fex.hot.tbl.frex-only.stats

k070.fex.hot.tbl
k070.fex.hot.tbl.frex-only.cdf

k070.fex.hot.tbl.frex-only.cdf
p(KS test)=
Npts= Median=
Mean=
p(t)=
Std=
p(F)=
k070.fex.hot.tbl.frex-only.stats

k071.fex.hot.tbl
k071.fex.hot.tbl.frex-only.cdf

k071.fex.hot.tbl.frex-only.cdf
p(KS test)=
Npts= Median=
Mean=
p(t)=
Std=
p(F)=
k071.fex.hot.tbl.frex-only.stats

k111.fex.hot.tbl
k111.fex.hot.tbl.frex-only.cdf

k111.fex.hot.tbl.frex-only.cdf
p(KS test)=0.181300.
Npts=3 Median=12
Mean=16
p(t)=0.430738
Std=8.72
p(F)=0.339140
k111.fex.hot.tbl.frex-only.stats

k112.fex.hot.tbl
k112.fex.hot.tbl.frex-only.cdf

k112.fex.hot.tbl.frex-only.cdf
p(KS test)=
Npts= Median=
Mean=
p(t)=
Std=
p(F)=
k112.fex.hot.tbl.frex-only.stats

k113.fex.hot.tbl
k113.fex.hot.tbl.frex-only.cdf

k113.fex.hot.tbl.frex-only.cdf
p(KS test)=0.270000.
Npts=2 Median=19
Mean=19
p(t)=0.521469
Std=11.3
p(F)=0.235992
k113.fex.hot.tbl.frex-only.stats

k114.fex.hot.tbl
k114.fex.hot.tbl.frex-only.cdf

k114.fex.hot.tbl.frex-only.cdf
p(KS test)=
Npts= Median=
Mean=
p(t)=
Std=
p(F)=
k114.fex.hot.tbl.frex-only.stats

k115.fex.hot.tbl
k115.fex.hot.tbl.frex-only.cdf

k115.fex.hot.tbl.frex-only.cdf
p(KS test)=
Npts= Median=
Mean=
p(t)=
Std=
p(F)=
k115.fex.hot.tbl.frex-only.stats

k116.fex.hot.tbl
k116.fex.hot.tbl.frex-only.cdf

k116.fex.hot.tbl.frex-only.cdf
p(KS test)=0.963945.
Npts=2 Median=16
Mean=16
p(t)=0.643188
Std=14.1
p(F)=0.189573
k116.fex.hot.tbl.frex-only.stats


Last update: 26-Aug-97 (3:21:31), Joe Mazzarella (mazz@ipac.caltech.edu )