Hot Pixel Analysis--- 970622n

NOTE: DO NOT EDIT THIS FILE! It is generated dynamically by software.
Night/hemisphere dataset: 970622n

28 scans (in low density regions) identified for analysis:
s020 s021 s022 s023 s024 s025 s026 s027 s028 s029 s030 s031 s032 s033 s046 s047 s048 s049 s050 s051 s052 s053 s054 s055 s056 s057 s058 s059

Procedures performed are outlined in Data Processing

Results

Figure 1---
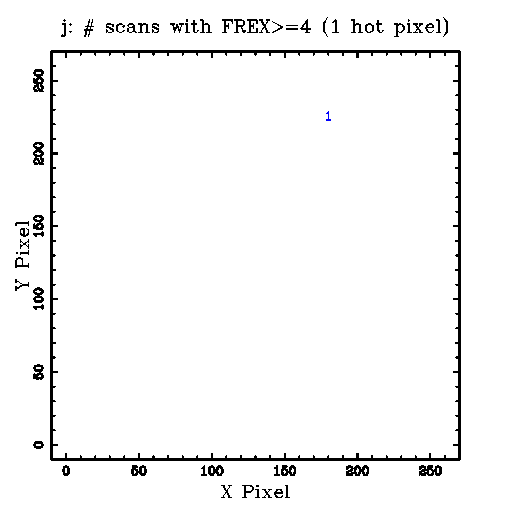
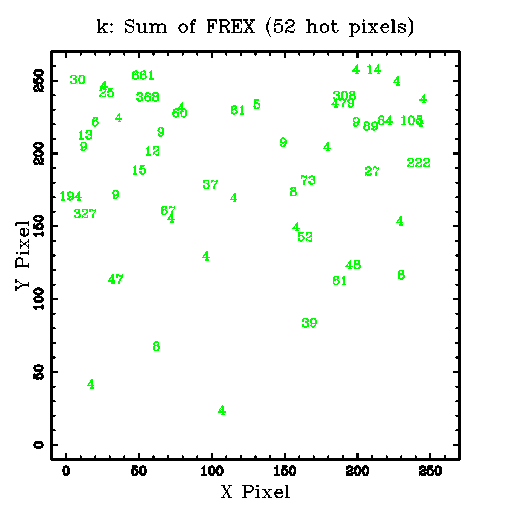
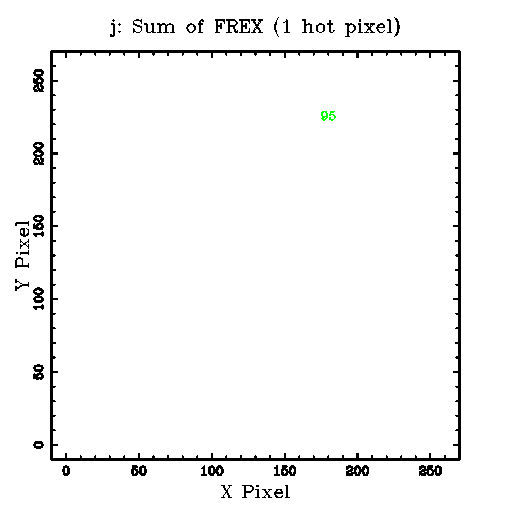
Row 1: The sum (coadd=stack) of 28 FREX (>=4) images. The plotted numbers indicate the sum of the FREX values at each pixel. Links to the FITS images are given below the K, H and J panel.
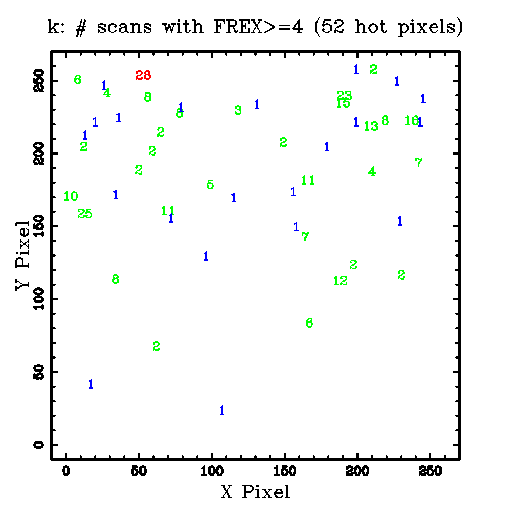
Row 2: The plotted numbers indicate the number of scans (1-28) in which FREX>=4 was found for each hot pixel.
Below the K, H and J panel are links to the corresponding tabular data.

K H J
1) Sum of FREX Images:
Tabular Data
OR mask in Fowler's Format
FITS Image
Tabular Data
OR mask in Fowler's Format
FITS Image
Tabular Data
OR mask in Fowler's Format
FITS Image
2) Scan Counts:
k.scan_cnt.tbl

h.scan_cnt.tbl

j.scan_cnt.tbl


Figure 2---
Histograms, CDFs, and comparison statistics for K-array FREX distributions.

Row 1: Data for the coadd (stack=sum) of 28 FREX (>=4) images.
Following 28 rows: Data for each scan.
Under each CDF plot is a link to the data file, and the p-level for the two-sample KS statistic. After the histogram and CFD plot are rows listing the number of points, median, mean, p-level for the Student's t test for different means, standard deviation, p-level for the F test for different variances, and a link to the original statistics program output file.

Histogram
cdf data file
CDF
cdf data file
p(KS test)
# PointsMedian
Mean
p(t)
Std
p(F)
Statistics file

k.fex.stack.hot.tbl
k.fex.stack.hot.tbl.frex-only.cdf

k.fex.stack.hot.tbl.frex-only.cdf
p(KS test)=0.000000.
Npts=52 Median=12.5
Mean=70.3
p(t)=1.000000
Std=132
p(F)=1.000000
k.fex.stack.hot.tbl.frex-only.stats

k020.fex.hot.tbl
k020.fex.hot.tbl.frex-only.cdf

k020.fex.hot.tbl.frex-only.cdf
p(KS test)=0.000000.
Npts=8 Median=7.5
Mean=9.12
p(t)=1.000000
Std=5.41
p(F)=1.000000
k020.fex.hot.tbl.frex-only.stats

k021.fex.hot.tbl
k021.fex.hot.tbl.frex-only.cdf

k021.fex.hot.tbl.frex-only.cdf
p(KS test)=0.925086.
Npts=12 Median=6.5
Mean=13.6
p(t)=0.556621
Std=23.3
p(F)=0.000778
k021.fex.hot.tbl.frex-only.stats

k022.fex.hot.tbl
k022.fex.hot.tbl.frex-only.cdf

k022.fex.hot.tbl.frex-only.cdf
p(KS test)=0.734407.
Npts=9 Median=7
Mean=19.9
p(t)=0.259971
Std=23.7
p(F)=0.000847
k022.fex.hot.tbl.frex-only.stats

k023.fex.hot.tbl
k023.fex.hot.tbl.frex-only.cdf

k023.fex.hot.tbl.frex-only.cdf
p(KS test)=0.591099.
Npts=6 Median=5
Mean=10.2
p(t)=0.849702
Std=11.4
p(F)=0.076596
k023.fex.hot.tbl.frex-only.stats

k024.fex.hot.tbl
k024.fex.hot.tbl.frex-only.cdf

k024.fex.hot.tbl.frex-only.cdf
p(KS test)=0.660386.
Npts=12 Median=6
Mean=16.2
p(t)=0.341380
Std=21.8
p(F)=0.001200
k024.fex.hot.tbl.frex-only.stats

k025.fex.hot.tbl
k025.fex.hot.tbl.frex-only.cdf

k025.fex.hot.tbl.frex-only.cdf
p(KS test)=0.984964.
Npts=9 Median=7
Mean=12.3
p(t)=0.550393
Std=13.5
p(F)=0.025868
k025.fex.hot.tbl.frex-only.stats

k026.fex.hot.tbl
k026.fex.hot.tbl.frex-only.cdf

k026.fex.hot.tbl.frex-only.cdf
p(KS test)=0.591099.
Npts=6 Median=11.5
Mean=10.2
p(t)=0.695809
Std=3.6
p(F)=0.387175
k026.fex.hot.tbl.frex-only.stats

k027.fex.hot.tbl
k027.fex.hot.tbl.frex-only.cdf

k027.fex.hot.tbl.frex-only.cdf
p(KS test)=0.647621.
Npts=10 Median=11
Mean=10
p(t)=0.727315
Std=4.24
p(F)=0.487266
k027.fex.hot.tbl.frex-only.stats

k028.fex.hot.tbl
k028.fex.hot.tbl.frex-only.cdf

k028.fex.hot.tbl.frex-only.cdf
p(KS test)=0.909735.
Npts=11 Median=9
Mean=10.8
p(t)=0.609059
Std=7.93
p(F)=0.321528
k028.fex.hot.tbl.frex-only.stats

k029.fex.hot.tbl
k029.fex.hot.tbl.frex-only.cdf

k029.fex.hot.tbl.frex-only.cdf
p(KS test)=0.647621.
Npts=10 Median=11.5
Mean=15.8
p(t)=0.334684
Std=18.2
p(F)=0.004138
k029.fex.hot.tbl.frex-only.stats

k030.fex.hot.tbl
k030.fex.hot.tbl.frex-only.cdf

k030.fex.hot.tbl.frex-only.cdf
p(KS test)=0.121126.
Npts=5 Median=20
Mean=28
p(t)=0.224175
Std=26.1
p(F)=0.000776
k030.fex.hot.tbl.frex-only.stats

k031.fex.hot.tbl
k031.fex.hot.tbl.frex-only.cdf

k031.fex.hot.tbl.frex-only.cdf
p(KS test)=0.188780.
Npts=9 Median=5
Mean=12
p(t)=0.653965
Std=16.8
p(F)=0.007329
k031.fex.hot.tbl.frex-only.stats

k032.fex.hot.tbl
k032.fex.hot.tbl.frex-only.cdf

k032.fex.hot.tbl.frex-only.cdf
p(KS test)=0.925086.
Npts=12 Median=8.5
Mean=13.9
p(t)=0.333010
Std=13.7
p(F)=0.021139
k032.fex.hot.tbl.frex-only.stats

k033.fex.hot.tbl
k033.fex.hot.tbl.frex-only.cdf

k033.fex.hot.tbl.frex-only.cdf
p(KS test)=0.660386.
Npts=12 Median=6
Mean=11.2
p(t)=0.612622
Std=11.8
p(F)=0.049642
k033.fex.hot.tbl.frex-only.stats

k046.fex.hot.tbl
k046.fex.hot.tbl.frex-only.cdf

k046.fex.hot.tbl.frex-only.cdf
p(KS test)=0.963945.
Npts=8 Median=7.5
Mean=7.5
p(t)=0.497426
Std=2.78
p(F)=0.099563
k046.fex.hot.tbl.frex-only.stats

k047.fex.hot.tbl
k047.fex.hot.tbl.frex-only.cdf

k047.fex.hot.tbl.frex-only.cdf
p(KS test)=0.943973.
Npts=10 Median=6.5
Mean=14.7
p(t)=0.406660
Std=18
p(F)=0.004488
k047.fex.hot.tbl.frex-only.stats

k048.fex.hot.tbl
k048.fex.hot.tbl.frex-only.cdf

k048.fex.hot.tbl.frex-only.cdf
p(KS test)=0.813565.
Npts=11 Median=10
Mean=12
p(t)=0.465234
Std=10
p(F)=0.115312
k048.fex.hot.tbl.frex-only.stats

k049.fex.hot.tbl
k049.fex.hot.tbl.frex-only.cdf

k049.fex.hot.tbl.frex-only.cdf
p(KS test)=0.823970.
Npts=9 Median=6
Mean=11.2
p(t)=0.660279
Std=11.9
p(F)=0.051832
k049.fex.hot.tbl.frex-only.stats

k050.fex.hot.tbl
k050.fex.hot.tbl.frex-only.cdf

k050.fex.hot.tbl.frex-only.cdf
p(KS test)=0.780445.
Npts=9 Median=9
Mean=21.4
p(t)=0.297831
Std=30
p(F)=0.000175
k050.fex.hot.tbl.frex-only.stats

k051.fex.hot.tbl
k051.fex.hot.tbl.frex-only.cdf

k051.fex.hot.tbl.frex-only.cdf
p(KS test)=0.963945.
Npts=8 Median=10.5
Mean=13.5
p(t)=0.355619
Std=10.3
p(F)=0.110471
k051.fex.hot.tbl.frex-only.stats

k052.fex.hot.tbl
k052.fex.hot.tbl.frex-only.cdf

k052.fex.hot.tbl.frex-only.cdf
p(KS test)=0.999342.
Npts=12 Median=7
Mean=15
p(t)=0.450717
Std=23.6
p(F)=0.000714
k052.fex.hot.tbl.frex-only.stats

k053.fex.hot.tbl
k053.fex.hot.tbl.frex-only.cdf

k053.fex.hot.tbl.frex-only.cdf
p(KS test)=0.999991.
Npts=13 Median=7
Mean=8.77
p(t)=0.894687
Std=6.02
p(F)=0.806905
k053.fex.hot.tbl.frex-only.stats

k054.fex.hot.tbl
k054.fex.hot.tbl.frex-only.cdf

k054.fex.hot.tbl.frex-only.cdf
p(KS test)=0.984964.
Npts=9 Median=9
Mean=13.8
p(t)=0.374097
Std=12.6
p(F)=0.038140
k054.fex.hot.tbl.frex-only.stats

k055.fex.hot.tbl
k055.fex.hot.tbl.frex-only.cdf

k055.fex.hot.tbl.frex-only.cdf
p(KS test)=0.647621.
Npts=10 Median=5
Mean=11.3
p(t)=0.614191
Std=11
p(F)=0.073415
k055.fex.hot.tbl.frex-only.stats

k056.fex.hot.tbl
k056.fex.hot.tbl.frex-only.cdf

k056.fex.hot.tbl.frex-only.cdf
p(KS test)=0.999991.
Npts=13 Median=8
Mean=13.9
p(t)=0.441421
Std=19.3
p(F)=0.002554
k056.fex.hot.tbl.frex-only.stats

k057.fex.hot.tbl
k057.fex.hot.tbl.frex-only.cdf

k057.fex.hot.tbl.frex-only.cdf
p(KS test)=0.999213.
Npts=10 Median=8
Mean=11.4
p(t)=0.564359
Std=9.72
p(F)=0.136443
k057.fex.hot.tbl.frex-only.stats

k058.fex.hot.tbl
k058.fex.hot.tbl.frex-only.cdf

k058.fex.hot.tbl.frex-only.cdf
p(KS test)=0.990216.
Npts=11 Median=7
Mean=9.45
p(t)=0.915845
Std=7.38
p(F)=0.422342
k058.fex.hot.tbl.frex-only.stats

k059.fex.hot.tbl
k059.fex.hot.tbl.frex-only.cdf

k059.fex.hot.tbl.frex-only.cdf
p(KS test)=0.522943.
Npts=13 Median=11
Mean=16.8
p(t)=0.169618
Std=15.3
p(F)=0.010558
k059.fex.hot.tbl.frex-only.stats


Last update: 7-Aug-97 (16:56:58), Joe Mazzarella (mazz@ipac.caltech.edu )