Hot Pixel Analysis--- 970706n

NOTE: DO NOT EDIT THIS FILE! It is generated dynamically by software.
Night/hemisphere dataset: 970706n

37 scans (in low density regions) identified for analysis:
s005 s006 s007 s008 s009 s010 s011 s012 s013 s014 s015 s016 s030 s031 s032 s033 s034 s035 s036 s037 s062 s064 s066 s067 s082 s083 s084 s085 s086 s087 s093 s106 s107 s108 s109 s110 s111

Procedures performed are outlined in Data Processing

Results

Figure 1---
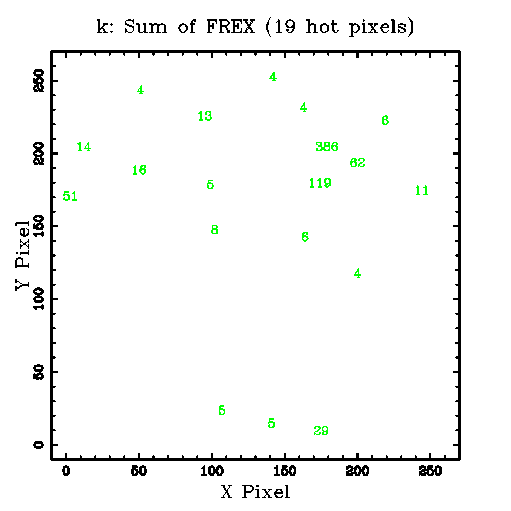
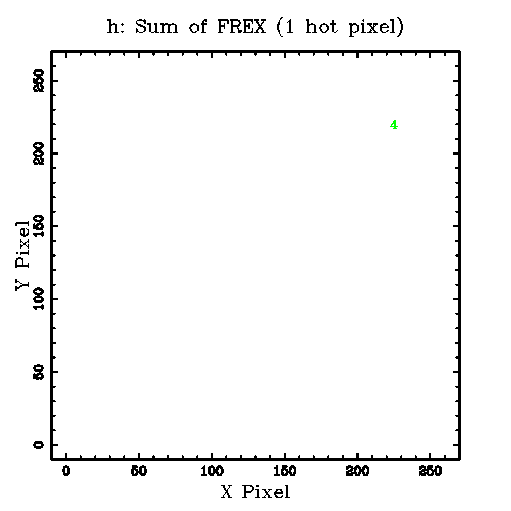
Row 1: The sum (coadd=stack) of 37 FREX (>=4) images. The plotted numbers indicate the sum of the FREX values at each pixel. Links to the FITS images are given below the K, H and J panel.
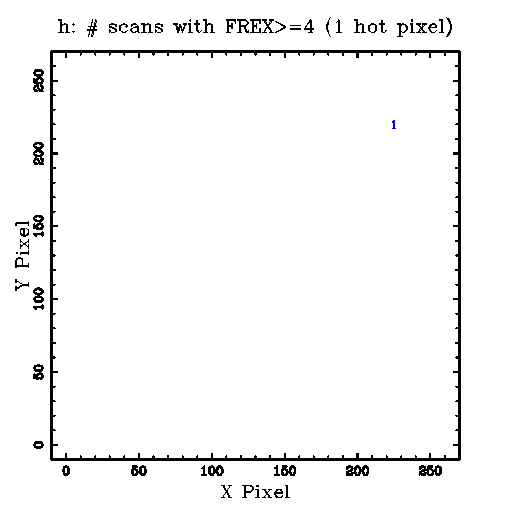
Row 2: The plotted numbers indicate the number of scans (1-37) in which FREX>=4 was found for each hot pixel.
Below the K, H and J panel are links to the corresponding tabular data.

K H J
1) Sum of FREX Images:
Tabular Data
OR mask in Fowler's Format
FITS Image
Tabular Data
OR mask in Fowler's Format
FITS Image

Tabular Data
OR mask in Fowler's Format
FITS Image
2) Scan Counts:
k.scan_cnt.tbl

h.scan_cnt.tbl

j.scan_cnt.tbl


Figure 2---
Histograms, CDFs, and comparison statistics for K-array FREX distributions.

Row 1: Data for the coadd (stack=sum) of 37 FREX (>=4) images.
Following 37 rows: Data for each scan.
Under each CDF plot is a link to the data file, and the p-level for the two-sample KS statistic. After the histogram and CFD plot are rows listing the number of points, median, mean, p-level for the Student's t test for different means, standard deviation, p-level for the F test for different variances, and a link to the original statistics program output file.

Histogram
cdf data file
CDF
cdf data file
p(KS test)
# PointsMedian
Mean
p(t)
Std
p(F)
Statistics file

k.fex.stack.hot.tbl
k.fex.stack.hot.tbl.frex-only.cdf

k.fex.stack.hot.tbl.frex-only.cdf
p(KS test)=0.000000.
Npts=19 Median=8
Mean=39.6
p(t)=1.000000
Std=88.7
p(F)=1.000000
k.fex.stack.hot.tbl.frex-only.stats

k005.fex.hot.tbl
k005.fex.hot.tbl.frex-only.cdf

k005.fex.hot.tbl.frex-only.cdf
p(KS test)=0.000000.
Npts=3 Median=10
Mean=10.7
p(t)=1.000000
Std=4.04
p(F)=1.000000
k005.fex.hot.tbl.frex-only.stats

k006.fex.hot.tbl
k006.fex.hot.tbl.frex-only.cdf

k006.fex.hot.tbl.frex-only.cdf
p(KS test)=0.925086.
Npts=2 Median=7
Mean=7
p(t)=0.567435
Std=4.24
p(F)=0.807921
k006.fex.hot.tbl.frex-only.stats

k007.fex.hot.tbl
k007.fex.hot.tbl.frex-only.cdf

k007.fex.hot.tbl.frex-only.cdf
p(KS test)=0.660386.
Npts=2 Median=5.5
Mean=5.5
p(t)=0.396543
Std=2.12
p(F)=0.695920
k007.fex.hot.tbl.frex-only.stats

k008.fex.hot.tbl
k008.fex.hot.tbl.frex-only.cdf

k008.fex.hot.tbl.frex-only.cdf
p(KS test)=
Npts= Median=
Mean=
p(t)=
Std=
p(F)=
k008.fex.hot.tbl.frex-only.stats

k009.fex.hot.tbl
k009.fex.hot.tbl.frex-only.cdf

k009.fex.hot.tbl.frex-only.cdf
p(KS test)=
Npts= Median=
Mean=
p(t)=
Std=
p(F)=
k009.fex.hot.tbl.frex-only.stats

k010.fex.hot.tbl
k010.fex.hot.tbl.frex-only.cdf

k010.fex.hot.tbl.frex-only.cdf
p(KS test)=
Npts= Median=
Mean=
p(t)=
Std=
p(F)=
k010.fex.hot.tbl.frex-only.stats

k011.fex.hot.tbl
k011.fex.hot.tbl.frex-only.cdf

k011.fex.hot.tbl.frex-only.cdf
p(KS test)=
Npts= Median=
Mean=
p(t)=
Std=
p(F)=
k011.fex.hot.tbl.frex-only.stats

k012.fex.hot.tbl
k012.fex.hot.tbl.frex-only.cdf

k012.fex.hot.tbl.frex-only.cdf
p(KS test)=
Npts= Median=
Mean=
p(t)=
Std=
p(F)=
k012.fex.hot.tbl.frex-only.stats

k013.fex.hot.tbl
k013.fex.hot.tbl.frex-only.cdf

k013.fex.hot.tbl.frex-only.cdf
p(KS test)=0.925086.
Npts=2 Median=7.5
Mean=7.5
p(t)=0.578548
Std=3.54
p(F)=0.947854
k013.fex.hot.tbl.frex-only.stats

k014.fex.hot.tbl
k014.fex.hot.tbl.frex-only.cdf

k014.fex.hot.tbl.frex-only.cdf
p(KS test)=
Npts= Median=
Mean=
p(t)=
Std=
p(F)=
k014.fex.hot.tbl.frex-only.stats

k015.fex.hot.tbl
k015.fex.hot.tbl.frex-only.cdf

k015.fex.hot.tbl.frex-only.cdf
p(KS test)=0.999342.
Npts=2 Median=9.5
Mean=9.5
p(t)=0.770901
Std=2.12
p(F)=0.695920
k015.fex.hot.tbl.frex-only.stats

k016.fex.hot.tbl
k016.fex.hot.tbl.frex-only.cdf

k016.fex.hot.tbl.frex-only.cdf
p(KS test)=0.925086.
Npts=2 Median=8.5
Mean=8.5
p(t)=0.767632
Std=6.36
p(F)=0.512007
k016.fex.hot.tbl.frex-only.stats

k030.fex.hot.tbl
k030.fex.hot.tbl.frex-only.cdf

k030.fex.hot.tbl.frex-only.cdf
p(KS test)=0.660386.
Npts=2 Median=6
Mean=6
p(t)=0.399666
Std=1.41
p(F)=0.480384
k030.fex.hot.tbl.frex-only.stats

k031.fex.hot.tbl
k031.fex.hot.tbl.frex-only.cdf

k031.fex.hot.tbl.frex-only.cdf
p(KS test)=
Npts= Median=
Mean=
p(t)=
Std=
p(F)=
k031.fex.hot.tbl.frex-only.stats

k032.fex.hot.tbl
k032.fex.hot.tbl.frex-only.cdf

k032.fex.hot.tbl.frex-only.cdf
p(KS test)=0.289819.
Npts=4 Median=5
Mean=8.75
p(t)=0.729409
Std=7.5
p(F)=0.466257
k032.fex.hot.tbl.frex-only.stats

k033.fex.hot.tbl
k033.fex.hot.tbl.frex-only.cdf

k033.fex.hot.tbl.frex-only.cdf
p(KS test)=0.999924.
Npts=4 Median=9
Mean=9.75
p(t)=0.820962
Std=4.65
p(F)=0.916223
k033.fex.hot.tbl.frex-only.stats

k034.fex.hot.tbl
k034.fex.hot.tbl.frex-only.cdf

k034.fex.hot.tbl.frex-only.cdf
p(KS test)=
Npts= Median=
Mean=
p(t)=
Std=
p(F)=
k034.fex.hot.tbl.frex-only.stats

k035.fex.hot.tbl
k035.fex.hot.tbl.frex-only.cdf

k035.fex.hot.tbl.frex-only.cdf
p(KS test)=
Npts= Median=
Mean=
p(t)=
Std=
p(F)=
k035.fex.hot.tbl.frex-only.stats

k036.fex.hot.tbl
k036.fex.hot.tbl.frex-only.cdf

k036.fex.hot.tbl.frex-only.cdf
p(KS test)=
Npts= Median=
Mean=
p(t)=
Std=
p(F)=
k036.fex.hot.tbl.frex-only.stats

k037.fex.hot.tbl
k037.fex.hot.tbl.frex-only.cdf

k037.fex.hot.tbl.frex-only.cdf
p(KS test)=
Npts= Median=
Mean=
p(t)=
Std=
p(F)=
k037.fex.hot.tbl.frex-only.stats

k062.fex.hot.tbl
k062.fex.hot.tbl.frex-only.cdf

k062.fex.hot.tbl.frex-only.cdf
p(KS test)=0.660386.
Npts=2 Median=6.5
Mean=6.5
p(t)=0.449564
Std=2.12
p(F)=0.695920
k062.fex.hot.tbl.frex-only.stats

k064.fex.hot.tbl
k064.fex.hot.tbl.frex-only.cdf

k064.fex.hot.tbl.frex-only.cdf
p(KS test)=0.925086.
Npts=2 Median=8
Mean=8
p(t)=0.652228
Std=4.24
p(F)=0.807921
k064.fex.hot.tbl.frex-only.stats

k066.fex.hot.tbl
k066.fex.hot.tbl.frex-only.cdf

k066.fex.hot.tbl.frex-only.cdf
p(KS test)=0.996255.
Npts=3 Median=12
Mean=10
p(t)=0.890683
Std=5.29
p(F)=0.736842
k066.fex.hot.tbl.frex-only.stats

k067.fex.hot.tbl
k067.fex.hot.tbl.frex-only.cdf

k067.fex.hot.tbl.frex-only.cdf
p(KS test)=0.517551.
Npts=3 Median=5
Mean=9.67
p(t)=0.888988
Std=8.96
p(F)=0.337931
k067.fex.hot.tbl.frex-only.stats

k082.fex.hot.tbl
k082.fex.hot.tbl.frex-only.cdf

k082.fex.hot.tbl.frex-only.cdf
p(KS test)=
Npts= Median=
Mean=
p(t)=
Std=
p(F)=
k082.fex.hot.tbl.frex-only.stats

k083.fex.hot.tbl
k083.fex.hot.tbl.frex-only.cdf

k083.fex.hot.tbl.frex-only.cdf
p(KS test)=0.660386.
Npts=2 Median=13
Mean=13
p(t)=0.580560
Std=1.41
p(F)=0.480384
k083.fex.hot.tbl.frex-only.stats

k084.fex.hot.tbl
k084.fex.hot.tbl.frex-only.cdf

k084.fex.hot.tbl.frex-only.cdf
p(KS test)=
Npts= Median=
Mean=
p(t)=
Std=
p(F)=
k084.fex.hot.tbl.frex-only.stats

k085.fex.hot.tbl
k085.fex.hot.tbl.frex-only.cdf

k085.fex.hot.tbl.frex-only.cdf
p(KS test)=0.660386.
Npts=2 Median=11.5
Mean=11.5
p(t)=0.806057
Std=0.707
p(F)=0.245564
k085.fex.hot.tbl.frex-only.stats

k086.fex.hot.tbl
k086.fex.hot.tbl.frex-only.cdf

k086.fex.hot.tbl.frex-only.cdf
p(KS test)=0.517551.
Npts=3 Median=17
Mean=14
p(t)=0.541637
Std=5.2
p(F)=0.753846
k086.fex.hot.tbl.frex-only.stats

k087.fex.hot.tbl
k087.fex.hot.tbl.frex-only.cdf

k087.fex.hot.tbl.frex-only.cdf
p(KS test)=0.999342.
Npts=2 Median=11.5
Mean=11.5
p(t)=0.886469
Std=4.95
p(F)=0.690693
k087.fex.hot.tbl.frex-only.stats

k093.fex.hot.tbl
k093.fex.hot.tbl.frex-only.cdf

k093.fex.hot.tbl.frex-only.cdf
p(KS test)=0.925086.
Npts=2 Median=14.5
Mean=14.5
p(t)=0.764096
Std=12
p(F)=0.193771
k093.fex.hot.tbl.frex-only.stats

k106.fex.hot.tbl
k106.fex.hot.tbl.frex-only.cdf

k106.fex.hot.tbl.frex-only.cdf
p(KS test)=0.517551.
Npts=3 Median=14
Mean=14.3
p(t)=0.380306
Std=1.53
p(F)=0.250000
k106.fex.hot.tbl.frex-only.stats

k107.fex.hot.tbl
k107.fex.hot.tbl.frex-only.cdf

k107.fex.hot.tbl.frex-only.cdf
p(KS test)=0.925086.
Npts=2 Median=14
Mean=14
p(t)=0.645616
Std=5.66
p(F)=0.593095
k107.fex.hot.tbl.frex-only.stats

k108.fex.hot.tbl
k108.fex.hot.tbl.frex-only.cdf

k108.fex.hot.tbl.frex-only.cdf
p(KS test)=0.784770.
Npts=4 Median=6.5
Mean=7.25
p(t)=0.439223
Std=3.95
p(F)=0.903306
k108.fex.hot.tbl.frex-only.stats

k109.fex.hot.tbl
k109.fex.hot.tbl.frex-only.cdf

k109.fex.hot.tbl.frex-only.cdf
p(KS test)=0.517551.
Npts=3 Median=6
Mean=6.67
p(t)=0.401956
Std=3.06
p(F)=0.727273
k109.fex.hot.tbl.frex-only.stats

k110.fex.hot.tbl
k110.fex.hot.tbl.frex-only.cdf

k110.fex.hot.tbl.frex-only.cdf
p(KS test)=0.927221.
Npts=4 Median=8.5
Mean=10.2
p(t)=0.934041
Std=6.85
p(F)=0.537599
k110.fex.hot.tbl.frex-only.stats

k111.fex.hot.tbl
k111.fex.hot.tbl.frex-only.cdf

k111.fex.hot.tbl.frex-only.cdf
p(KS test)=0.927221.
Npts=4 Median=7.5
Mean=9
p(t)=0.716384
Std=5.6
p(F)=0.721419
k111.fex.hot.tbl.frex-only.stats


Last update: 25-Aug-97 (20:55:41), Joe Mazzarella (mazz@ipac.caltech.edu )