Hot Pixel Analysis--- 970903n

NOTE: DO NOT EDIT THIS FILE! It is generated dynamically by software.
Night/hemisphere dataset: 970903n

32 scans (in low density regions) identified for analysis:
s002 s003 s004 s005 s006 s007 s008 s009 s011 s012 s027 s028 s029 s030 s031 s032 s035 s036 s037 s038 s049 s050 s051 s052 s053 s054 s071 s072 s073 s074 s075 s076

Procedures performed are outlined in Data Processing

Results

Figure 1---
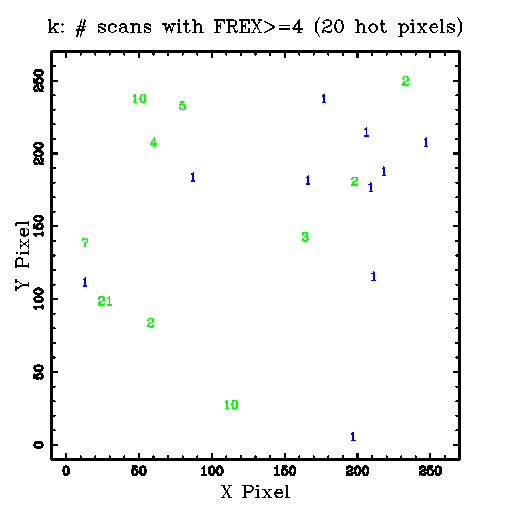
Row 1: The sum (coadd=stack) of 32 FREX (>=4) images. The plotted numbers indicate the sum of the FREX values at each pixel. Links to the FITS images are given below the K, H and J panel.
Row 2: The plotted numbers indicate the number of scans (1-32) in which FREX>=4 was found for each hot pixel.
Below the K, H and J panel are links to the corresponding tabular data.

K H J
1) Sum of FREX Images:
Tabular Data
OR mask in Fowler's Format
FITS Image

Tabular Data
OR mask in Fowler's Format
FITS Image
Tabular Data
OR mask in Fowler's Format
FITS Image
2) Scan Counts:
k.scan_cnt.tbl

h.scan_cnt.tbl

j.scan_cnt.tbl


Figure 2---
Histograms, CDFs, and comparison statistics for K-array FREX distributions.

Row 1: Data for the coadd (stack=sum) of 32 FREX (>=4) images.
Following 32 rows: Data for each scan.
Under each CDF plot is a link to the data file, and the p-level for the two-sample KS statistic. After the histogram and CFD plot are rows listing the number of points, median, mean, p-level for the Student's t test for different means, standard deviation, p-level for the F test for different variances, and a link to the original statistics program output file.

Histogram
cdf data file
CDF
cdf data file
p(KS test)
# PointsMedian
Mean
p(t)
Std
p(F)
Statistics file

k.fex.stack.hot.tbl
k.fex.stack.hot.tbl.frex-only.cdf

k.fex.stack.hot.tbl.frex-only.cdf
p(KS test)=0.000000.
Npts=20 Median=13
Mean=44
p(t)=1.000000
Std=60.3
p(F)=1.000000
k.fex.stack.hot.tbl.frex-only.stats

k002.fex.hot.tbl
k002.fex.hot.tbl.frex-only.cdf

k002.fex.hot.tbl.frex-only.cdf
p(KS test)=0.000000.
Npts=2 Median=11.5
Mean=11.5
p(t)=1.000000
Std=10.6
p(F)=1.000000
k002.fex.hot.tbl.frex-only.stats

k003.fex.hot.tbl
k003.fex.hot.tbl.frex-only.cdf

k003.fex.hot.tbl.frex-only.cdf
p(KS test)=0.892778.
Npts=4 Median=6
Mean=8.5
p(t)=0.787032
Std=5.69
p(F)=0.317981
k003.fex.hot.tbl.frex-only.stats

k004.fex.hot.tbl
k004.fex.hot.tbl.frex-only.cdf

k004.fex.hot.tbl.frex-only.cdf
p(KS test)=0.892778.
Npts=4 Median=6
Mean=8.5
p(t)=0.791156
Std=6.61
p(F)=0.413634
k004.fex.hot.tbl.frex-only.stats

k005.fex.hot.tbl
k005.fex.hot.tbl.frex-only.cdf

k005.fex.hot.tbl.frex-only.cdf
p(KS test)=0.999342.
Npts=3 Median=6
Mean=10.7
p(t)=0.948642
Std=9.87
p(F)=0.789627
k005.fex.hot.tbl.frex-only.stats

k006.fex.hot.tbl
k006.fex.hot.tbl.frex-only.cdf

k006.fex.hot.tbl.frex-only.cdf
p(KS test)=
Npts= Median=
Mean=
p(t)=
Std=
p(F)=
k006.fex.hot.tbl.frex-only.stats

k007.fex.hot.tbl
k007.fex.hot.tbl.frex-only.cdf

k007.fex.hot.tbl.frex-only.cdf
p(KS test)=0.963945.
Npts=2 Median=12.5
Mean=12.5
p(t)=0.932314
Std=3.54
p(F)=0.409665
k007.fex.hot.tbl.frex-only.stats

k008.fex.hot.tbl
k008.fex.hot.tbl.frex-only.cdf

k008.fex.hot.tbl.frex-only.cdf
p(KS test)=0.925086.
Npts=3 Median=15
Mean=14.7
p(t)=0.786350
Std=5.51
p(F)=0.387966
k008.fex.hot.tbl.frex-only.stats

k009.fex.hot.tbl
k009.fex.hot.tbl.frex-only.cdf

k009.fex.hot.tbl.frex-only.cdf
p(KS test)=0.963945.
Npts=2 Median=7
Mean=7
p(t)=0.726837
Std=2.83
p(F)=0.331809
k009.fex.hot.tbl.frex-only.stats

k011.fex.hot.tbl
k011.fex.hot.tbl.frex-only.cdf

k011.fex.hot.tbl.frex-only.cdf
p(KS test)=
Npts= Median=
Mean=
p(t)=
Std=
p(F)=
k011.fex.hot.tbl.frex-only.stats

k012.fex.hot.tbl
k012.fex.hot.tbl.frex-only.cdf

k012.fex.hot.tbl.frex-only.cdf
p(KS test)=
Npts= Median=
Mean=
p(t)=
Std=
p(F)=
k012.fex.hot.tbl.frex-only.stats

k027.fex.hot.tbl
k027.fex.hot.tbl.frex-only.cdf

k027.fex.hot.tbl.frex-only.cdf
p(KS test)=0.892778.
Npts=4 Median=14.5
Mean=12.8
p(t)=0.908550
Std=6.18
p(F)=0.369715
k027.fex.hot.tbl.frex-only.stats

k028.fex.hot.tbl
k028.fex.hot.tbl.frex-only.cdf

k028.fex.hot.tbl.frex-only.cdf
p(KS test)=
Npts= Median=
Mean=
p(t)=
Std=
p(F)=
k028.fex.hot.tbl.frex-only.stats

k029.fex.hot.tbl
k029.fex.hot.tbl.frex-only.cdf

k029.fex.hot.tbl.frex-only.cdf
p(KS test)=
Npts= Median=
Mean=
p(t)=
Std=
p(F)=
k029.fex.hot.tbl.frex-only.stats

k030.fex.hot.tbl
k030.fex.hot.tbl.frex-only.cdf

k030.fex.hot.tbl.frex-only.cdf
p(KS test)=0.925086.
Npts=3 Median=11
Mean=15.3
p(t)=0.766699
Std=8.39
p(F)=0.666776
k030.fex.hot.tbl.frex-only.stats

k031.fex.hot.tbl
k031.fex.hot.tbl.frex-only.cdf

k031.fex.hot.tbl.frex-only.cdf
p(KS test)=0.925086.
Npts=3 Median=4
Mean=4
p(t)=0.557703
Std=0
p(F)=0.000000
k031.fex.hot.tbl.frex-only.stats

k032.fex.hot.tbl
k032.fex.hot.tbl.frex-only.cdf

k032.fex.hot.tbl.frex-only.cdf
p(KS test)=0.925086.
Npts=3 Median=9
Mean=9.33
p(t)=0.838301
Std=1.53
p(F)=0.040234
k032.fex.hot.tbl.frex-only.stats

k035.fex.hot.tbl
k035.fex.hot.tbl.frex-only.cdf

k035.fex.hot.tbl.frex-only.cdf
p(KS test)=0.963945.
Npts=2 Median=12.5
Mean=12.5
p(t)=0.952604
Std=12
p(F)=0.920526
k035.fex.hot.tbl.frex-only.stats

k036.fex.hot.tbl
k036.fex.hot.tbl.frex-only.cdf

k036.fex.hot.tbl.frex-only.cdf
p(KS test)=0.925086.
Npts=3 Median=15
Mean=12
p(t)=0.965874
Std=7
p(F)=0.537889
k036.fex.hot.tbl.frex-only.stats

k037.fex.hot.tbl
k037.fex.hot.tbl.frex-only.cdf

k037.fex.hot.tbl.frex-only.cdf
p(KS test)=
Npts= Median=
Mean=
p(t)=
Std=
p(F)=
k037.fex.hot.tbl.frex-only.stats

k038.fex.hot.tbl
k038.fex.hot.tbl.frex-only.cdf

k038.fex.hot.tbl.frex-only.cdf
p(KS test)=0.925086.
Npts=3 Median=18
Mean=17
p(t)=0.646061
Std=2.65
p(F)=0.113916
k038.fex.hot.tbl.frex-only.stats

k049.fex.hot.tbl
k049.fex.hot.tbl.frex-only.cdf

k049.fex.hot.tbl.frex-only.cdf
p(KS test)=0.963945.
Npts=2 Median=11
Mean=11
p(t)=0.973745
Std=9.9
p(F)=0.956112
k049.fex.hot.tbl.frex-only.stats

k050.fex.hot.tbl
k050.fex.hot.tbl.frex-only.cdf

k050.fex.hot.tbl.frex-only.cdf
p(KS test)=0.963945.
Npts=2 Median=14.5
Mean=14.5
p(t)=0.877812
Std=14.8
p(F)=0.789726
k050.fex.hot.tbl.frex-only.stats

k051.fex.hot.tbl
k051.fex.hot.tbl.frex-only.cdf

k051.fex.hot.tbl.frex-only.cdf
p(KS test)=0.999524.
Npts=5 Median=5
Mean=9
p(t)=0.826821
Std=8.97
p(F)=0.605228
k051.fex.hot.tbl.frex-only.stats

k052.fex.hot.tbl
k052.fex.hot.tbl.frex-only.cdf

k052.fex.hot.tbl.frex-only.cdf
p(KS test)=0.925086.
Npts=3 Median=17
Mean=17
p(t)=0.708247
Std=11
p(F)=0.873327
k052.fex.hot.tbl.frex-only.stats

k053.fex.hot.tbl
k053.fex.hot.tbl.frex-only.cdf

k053.fex.hot.tbl.frex-only.cdf
p(KS test)=0.963945.
Npts=2 Median=8.5
Mean=8.5
p(t)=0.815827
Std=4.95
p(F)=0.555931
k053.fex.hot.tbl.frex-only.stats

k054.fex.hot.tbl
k054.fex.hot.tbl.frex-only.cdf

k054.fex.hot.tbl.frex-only.cdf
p(KS test)=0.925086.
Npts=3 Median=7
Mean=6.67
p(t)=0.678455
Std=2.52
p(F)=0.103897
k054.fex.hot.tbl.frex-only.stats

k071.fex.hot.tbl
k071.fex.hot.tbl.frex-only.cdf

k071.fex.hot.tbl.frex-only.cdf
p(KS test)=0.925086.
Npts=3 Median=13
Mean=11
p(t)=0.963257
Std=4.36
p(F)=0.270829
k071.fex.hot.tbl.frex-only.stats

k072.fex.hot.tbl
k072.fex.hot.tbl.frex-only.cdf

k072.fex.hot.tbl.frex-only.cdf
p(KS test)=0.963945.
Npts=2 Median=15
Mean=15
p(t)=0.804268
Std=7.07
p(F)=0.748668
k072.fex.hot.tbl.frex-only.stats

k073.fex.hot.tbl
k073.fex.hot.tbl.frex-only.cdf

k073.fex.hot.tbl.frex-only.cdf
p(KS test)=0.925086.
Npts=3 Median=15
Mean=14
p(t)=0.817586
Std=2.65
p(F)=0.113916
k073.fex.hot.tbl.frex-only.stats

k074.fex.hot.tbl
k074.fex.hot.tbl.frex-only.cdf

k074.fex.hot.tbl.frex-only.cdf
p(KS test)=0.963945.
Npts=2 Median=13
Mean=13
p(t)=0.921965
Std=9.9
p(F)=0.956112
k074.fex.hot.tbl.frex-only.stats

k075.fex.hot.tbl
k075.fex.hot.tbl.frex-only.cdf

k075.fex.hot.tbl.frex-only.cdf
p(KS test)=0.963945.
Npts=2 Median=13.5
Mean=13.5
p(t)=0.879728
Std=6.36
p(F)=0.688083
k075.fex.hot.tbl.frex-only.stats

k076.fex.hot.tbl
k076.fex.hot.tbl.frex-only.cdf

k076.fex.hot.tbl.frex-only.cdf
p(KS test)=0.963945.
Npts=2 Median=15
Mean=15
p(t)=0.804268
Std=7.07
p(F)=0.748668
k076.fex.hot.tbl.frex-only.stats


Last update: 11-Sep-97 (9:29:13), Joe Mazzarella (mazz@ipac.caltech.edu )