Hot Pixel Analysis--- 971205n

NOTE: DO NOT EDIT THIS FILE! It is generated dynamically by software.
Night/hemisphere dataset: 971205n

28 scans (in low density regions) identified for analysis:
s004 s005 s006 s015 s016 s017 s018 s019 s020 s043 s044 s045 s046 s047 s048 s059 s070 s071 s072 s073 s074 s075 s151 s152 s153 s154 s155 s156

Procedures performed are outlined in Data Processing

Results

Figure 1---
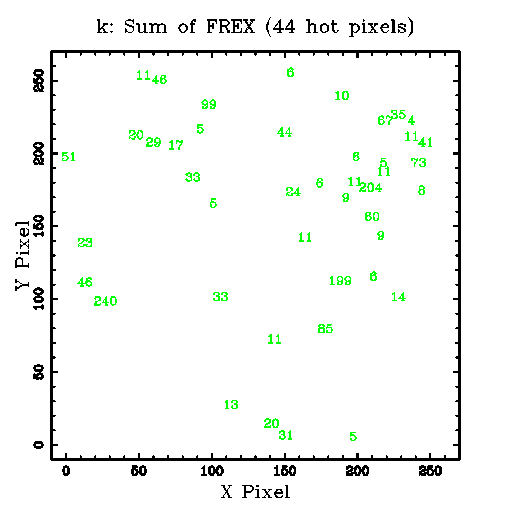
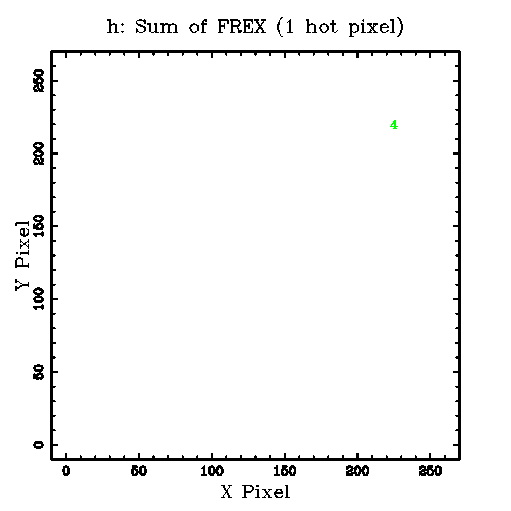
Row 1: The sum (coadd=stack) of 28 FREX (>=4) images. The plotted numbers indicate the sum of the FREX values at each pixel. Links to the FITS images are given below the K, H and J panel.
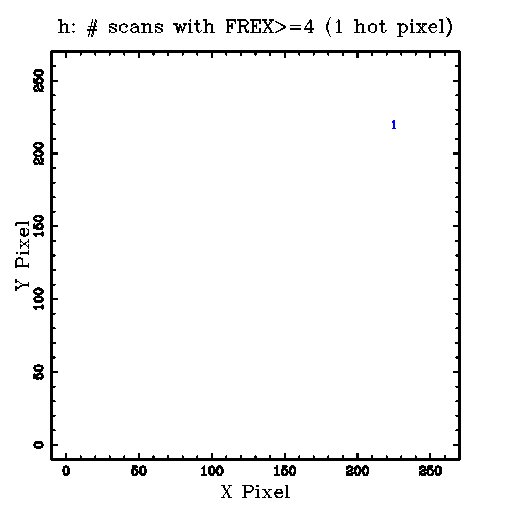
Row 2: The plotted numbers indicate the number of scans (1-28) in which FREX>=4 was found for each hot pixel.
Below the K, H and J panel are links to the corresponding tabular data.

K H J
1) Sum of FREX Images:
Tabular Data
OR mask in Fowler's Format
FITS Image
Tabular Data
OR mask in Fowler's Format
FITS Image

Tabular Data
OR mask in Fowler's Format
FITS Image
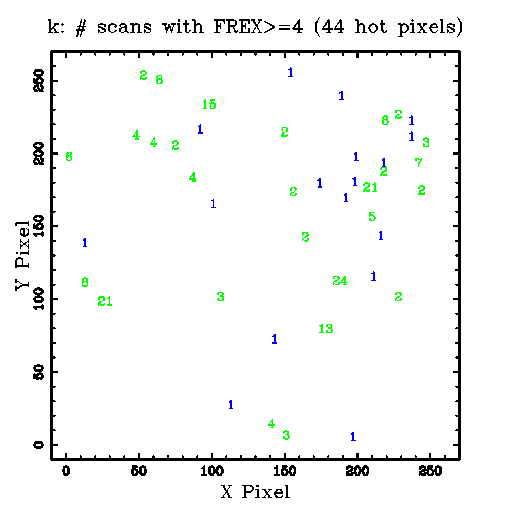
2) Scan Counts:
k.scan_cnt.tbl

h.scan_cnt.tbl

j.scan_cnt.tbl


Figure 2---
Histograms, CDFs, and comparison statistics for K-array FREX distributions.

Row 1: Data for the coadd (stack=sum) of 28 FREX (>=4) images.
Following 28 rows: Data for each scan.
Under each CDF plot is a link to the data file, and the p-level for the two-sample KS statistic. After the histogram and CFD plot are rows listing the number of points, median, mean, p-level for the Student's t test for different means, standard deviation, p-level for the F test for different variances, and a link to the original statistics program output file.

Histogram
cdf data file
CDF
cdf data file
p(KS test)
# PointsMedian
Mean
p(t)
Std
p(F)
Statistics file

k.fex.stack.hot.tbl
k.fex.stack.hot.tbl.frex-only.cdf

k.fex.stack.hot.tbl.frex-only.cdf
p(KS test)=0.000000.
Npts=44 Median=18.5
Mean=38.6
p(t)=1.000000
Std=53.6
p(F)=1.000000
k.fex.stack.hot.tbl.frex-only.stats

k004.fex.hot.tbl
k004.fex.hot.tbl.frex-only.cdf

k004.fex.hot.tbl.frex-only.cdf
p(KS test)=0.000000.
Npts=5 Median=6
Mean=7.2
p(t)=1.000000
Std=2.39
p(F)=1.000000
k004.fex.hot.tbl.frex-only.stats

k005.fex.hot.tbl
k005.fex.hot.tbl.frex-only.cdf

k005.fex.hot.tbl.frex-only.cdf
p(KS test)=0.509458.
Npts=3 Median=10
Mean=9.67
p(t)=0.357125
Std=2.52
p(F)=0.826531
k005.fex.hot.tbl.frex-only.stats

k006.fex.hot.tbl
k006.fex.hot.tbl.frex-only.cdf

k006.fex.hot.tbl.frex-only.cdf
p(KS test)=0.944650.
Npts=8 Median=5.5
Mean=7.62
p(t)=0.857148
Std=5.24
p(F)=0.148063
k006.fex.hot.tbl.frex-only.stats

k015.fex.hot.tbl
k015.fex.hot.tbl.frex-only.cdf

k015.fex.hot.tbl.frex-only.cdf
p(KS test)=0.971133.
Npts=7 Median=6
Mean=6.71
p(t)=0.808235
Std=3.82
p(F)=0.382798
k015.fex.hot.tbl.frex-only.stats

k016.fex.hot.tbl
k016.fex.hot.tbl.frex-only.cdf

k016.fex.hot.tbl.frex-only.cdf
p(KS test)=0.592503.
Npts=6 Median=10
Mean=9.83
p(t)=0.308899
Std=4.17
p(F)=0.302894
k016.fex.hot.tbl.frex-only.stats

k017.fex.hot.tbl
k017.fex.hot.tbl.frex-only.cdf

k017.fex.hot.tbl.frex-only.cdf
p(KS test)=0.818621.
Npts=5 Median=5
Mean=7.2
p(t)=1.000000
Std=4.09
p(F)=0.322604
k017.fex.hot.tbl.frex-only.stats

k018.fex.hot.tbl
k018.fex.hot.tbl.frex-only.cdf

k018.fex.hot.tbl.frex-only.cdf
p(KS test)=0.329105.
Npts=5 Median=12
Mean=10.8
p(t)=0.205281
Std=3.63
p(F)=0.436006
k018.fex.hot.tbl.frex-only.stats

k019.fex.hot.tbl
k019.fex.hot.tbl.frex-only.cdf

k019.fex.hot.tbl.frex-only.cdf
p(KS test)=0.935500.
Npts=7 Median=8
Mean=9.86
p(t)=0.387628
Std=6.07
p(F)=0.092424
k019.fex.hot.tbl.frex-only.stats

k020.fex.hot.tbl
k020.fex.hot.tbl.frex-only.cdf

k020.fex.hot.tbl.frex-only.cdf
p(KS test)=0.974110.
Npts=8 Median=6.5
Mean=6.62
p(t)=0.710846
Std=2.5
p(F)=0.984407
k020.fex.hot.tbl.frex-only.stats

k043.fex.hot.tbl
k043.fex.hot.tbl.frex-only.cdf

k043.fex.hot.tbl.frex-only.cdf
p(KS test)=0.309699.
Npts=8 Median=5
Mean=6.38
p(t)=0.696560
Std=4.41
p(F)=0.253482
k043.fex.hot.tbl.frex-only.stats

k044.fex.hot.tbl
k044.fex.hot.tbl.frex-only.cdf

k044.fex.hot.tbl.frex-only.cdf
p(KS test)=0.990646.
Npts=8 Median=7.5
Mean=10.5
p(t)=0.363519
Std=7.91
p(F)=0.035467
k044.fex.hot.tbl.frex-only.stats

k045.fex.hot.tbl
k045.fex.hot.tbl.frex-only.cdf

k045.fex.hot.tbl.frex-only.cdf
p(KS test)=0.922332.
Npts=6 Median=7
Mean=9.17
p(t)=0.540686
Std=6.18
p(F)=0.089244
k045.fex.hot.tbl.frex-only.stats

k046.fex.hot.tbl
k046.fex.hot.tbl.frex-only.cdf

k046.fex.hot.tbl.frex-only.cdf
p(KS test)=0.818621.
Npts=5 Median=11
Mean=12
p(t)=0.230595
Std=5.83
p(F)=0.111847
k046.fex.hot.tbl.frex-only.stats

k047.fex.hot.tbl
k047.fex.hot.tbl.frex-only.cdf

k047.fex.hot.tbl.frex-only.cdf
p(KS test)=0.775449.
Npts=6 Median=6.5
Mean=6
p(t)=0.408899
Std=1.26
p(F)=0.196030
k047.fex.hot.tbl.frex-only.stats

k048.fex.hot.tbl
k048.fex.hot.tbl.frex-only.cdf

k048.fex.hot.tbl.frex-only.cdf
p(KS test)=0.971133.
Npts=7 Median=6
Mean=8.29
p(t)=0.701536
Std=6.02
p(F)=0.094902
k048.fex.hot.tbl.frex-only.stats

k059.fex.hot.tbl
k059.fex.hot.tbl.frex-only.cdf

k059.fex.hot.tbl.frex-only.cdf
p(KS test)=0.971133.
Npts=7 Median=7
Mean=8.71
p(t)=0.608837
Std=6.24
p(F)=0.084119
k059.fex.hot.tbl.frex-only.stats

k070.fex.hot.tbl
k070.fex.hot.tbl.frex-only.cdf

k070.fex.hot.tbl.frex-only.cdf
p(KS test)=0.660386.
Npts=10 Median=9
Mean=9.7
p(t)=0.253604
Std=4.35
p(F)=0.260479
k070.fex.hot.tbl.frex-only.stats

k071.fex.hot.tbl
k071.fex.hot.tbl.frex-only.cdf

k071.fex.hot.tbl.frex-only.cdf
p(KS test)=0.274286.
Npts=9 Median=12
Mean=12.4
p(t)=0.147710
Std=7.09
p(F)=0.051624
k071.fex.hot.tbl.frex-only.stats

k072.fex.hot.tbl
k072.fex.hot.tbl.frex-only.cdf

k072.fex.hot.tbl.frex-only.cdf
p(KS test)=0.990646.
Npts=8 Median=7
Mean=8.88
p(t)=0.509059
Std=5.41
p(F)=0.133052
k072.fex.hot.tbl.frex-only.stats

k073.fex.hot.tbl
k073.fex.hot.tbl.frex-only.cdf

k073.fex.hot.tbl.frex-only.cdf
p(KS test)=0.966791.
Npts=6 Median=8.5
Mean=8.67
p(t)=0.493919
Std=3.56
p(F)=0.459179
k073.fex.hot.tbl.frex-only.stats

k074.fex.hot.tbl
k074.fex.hot.tbl.frex-only.cdf

k074.fex.hot.tbl.frex-only.cdf
p(KS test)=0.485805.
Npts=9 Median=11
Mean=9.44
p(t)=0.281383
Std=3.84
p(F)=0.373356
k074.fex.hot.tbl.frex-only.stats

k075.fex.hot.tbl
k075.fex.hot.tbl.frex-only.cdf

k075.fex.hot.tbl.frex-only.cdf
p(KS test)=0.309699.
Npts=8 Median=10
Mean=10
p(t)=0.207840
Std=3.63
p(F)=0.437962
k075.fex.hot.tbl.frex-only.stats

k151.fex.hot.tbl
k151.fex.hot.tbl.frex-only.cdf

k151.fex.hot.tbl.frex-only.cdf
p(KS test)=0.845303.
Npts=8 Median=7.5
Mean=8.25
p(t)=0.597491
Std=3.92
p(F)=0.355114
k151.fex.hot.tbl.frex-only.stats

k152.fex.hot.tbl
k152.fex.hot.tbl.frex-only.cdf

k152.fex.hot.tbl.frex-only.cdf
p(KS test)=0.990646.
Npts=8 Median=6
Mean=6.88
p(t)=0.860401
Std=3.64
p(F)=0.432566
k152.fex.hot.tbl.frex-only.stats

k153.fex.hot.tbl
k153.fex.hot.tbl.frex-only.cdf

k153.fex.hot.tbl.frex-only.cdf
p(KS test)=0.971133.
Npts=7 Median=7
Mean=8
p(t)=0.718791
Std=4.4
p(F)=0.257247
k153.fex.hot.tbl.frex-only.stats

k154.fex.hot.tbl
k154.fex.hot.tbl.frex-only.cdf

k154.fex.hot.tbl.frex-only.cdf
p(KS test)=0.990169.
Npts=6 Median=7.5
Mean=7.5
p(t)=0.872527
Std=3.15
p(F)=0.612741
k154.fex.hot.tbl.frex-only.stats

k155.fex.hot.tbl
k155.fex.hot.tbl.frex-only.cdf

k155.fex.hot.tbl.frex-only.cdf
p(KS test)=0.811159.
Npts=9 Median=9
Mean=8.11
p(t)=0.608478
Std=3.48
p(F)=0.486751
k155.fex.hot.tbl.frex-only.stats

k156.fex.hot.tbl
k156.fex.hot.tbl.frex-only.cdf

k156.fex.hot.tbl.frex-only.cdf
p(KS test)=0.971133.
Npts=7 Median=7
Mean=8
p(t)=0.747240
Std=5.13
p(F)=0.160264
k156.fex.hot.tbl.frex-only.stats


Last update: 2-Apr-98 (10:57:6), Joe Mazzarella (mazz@ipac.caltech.edu )