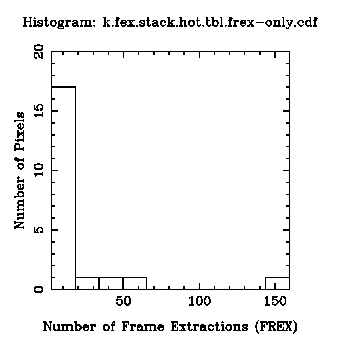
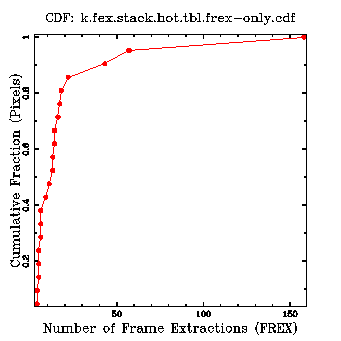
Tabular Data
OR mask in Fowler's Format
FITS Image
Tabular Data
OR mask in Fowler's Format
FITS Image
Tabular Data
OR mask in Fowler's Format
FITS Image
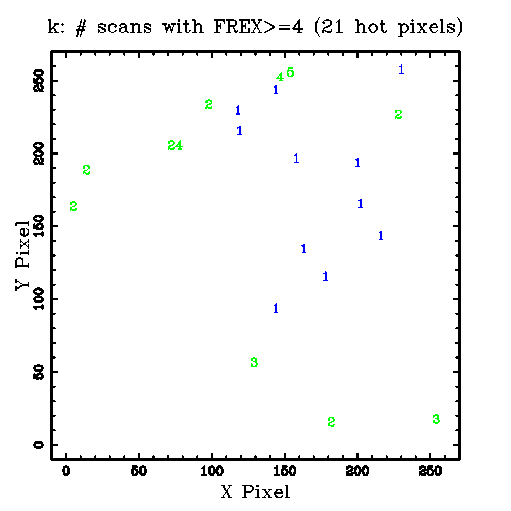
k.scan_cnt.tbl

h.scan_cnt.tbl
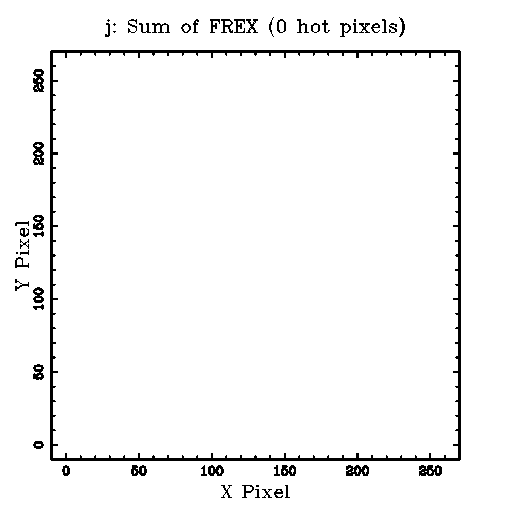
j.scan_cnt.tbl
37 scans (in low density regions) identified for analysis:
s001 s002 s003 s004 s005 s006 s015 s016 s017 s018 s019 s020 s029 s030 s031 s032 s033 s034 s042 s044 s055 s056 s057 s058 s059 s060 s068 s069 s071 s072 s073 s094 s095 s096 s097 s098 s099
Procedures performed are outlined in Data Processing
| K | H | J | |
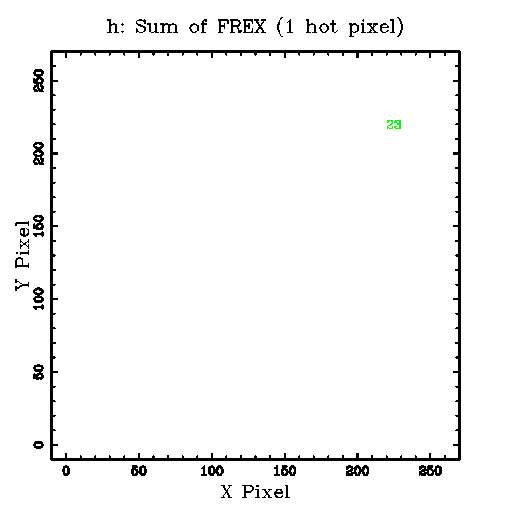
| 1) Sum of FREX Images: | Tabular Data OR mask in Fowler's Format FITS Image |
Tabular Data OR mask in Fowler's Format FITS Image |
Tabular Data OR mask in Fowler's Format FITS Image |
| 2) Scan Counts: | k.scan_cnt.tbl |
h.scan_cnt.tbl |
j.scan_cnt.tbl |