Hot Pixel Analysis--- 981028n

NOTE: DO NOT EDIT THIS FILE! It is generated dynamically by software.
Night/hemisphere dataset: 981028n

47 scans (in low density regions) identified for analysis:
s008 s009 s010 s011 s012 s013 s022 s023 s024 s025 s026 s027 s036 s037 s038 s039 s040 s041 s050 s051 s052 s053 s054 s055 s064 s066 s067 s069 s078 s079 s080 s081 s082 s083 s092 s093 s094 s095 s096 s097 s120 s121 s122 s123 s124 s125 s153

Procedures performed are outlined in Data Processing

Results

Figure 1---
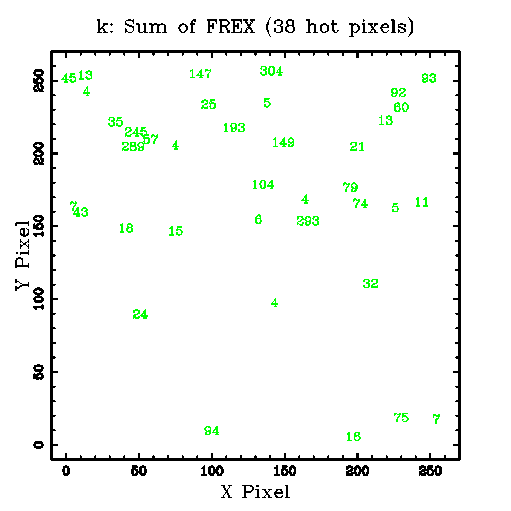
Row 1: The sum (coadd=stack) of 47 FREX (>=4) images. The plotted numbers indicate the sum of the FREX values at each pixel. Links to the FITS images are given below the K, H and J panel.
Row 2: The plotted numbers indicate the number of scans (1-47) in which FREX>=4 was found for each hot pixel.
Below the K, H and J panel are links to the corresponding tabular data.

K H J
1) Sum of FREX Images:
Tabular Data
OR mask in Fowler's Format
FITS Image

Tabular Data
OR mask in Fowler's Format
FITS Image
Tabular Data
OR mask in Fowler's Format
FITS Image
2) Scan Counts:
k.scan_cnt.tbl

h.scan_cnt.tbl

j.scan_cnt.tbl


Figure 2---
Histograms, CDFs, and comparison statistics for K-array FREX distributions.

Row 1: Data for the coadd (stack=sum) of 47 FREX (>=4) images.
Following 47 rows: Data for each scan.
Under each CDF plot is a link to the data file, and the p-level for the two-sample KS statistic. After the histogram and CFD plot are rows listing the number of points, median, mean, p-level for the Student's t test for different means, standard deviation, p-level for the F test for different variances, and a link to the original statistics program output file.

Histogram
cdf data file
CDF
cdf data file
p(KS test)
# PointsMedian
Mean
p(t)
Std
p(F)
Statistics file

k.fex.stack.hot.tbl
k.fex.stack.hot.tbl.frex-only.cdf

k.fex.stack.hot.tbl.frex-only.cdf
p(KS test)=0.000000.
Npts=38 Median=33.5
Mean=71.2
p(t)=1.000000
Std=87.1
p(F)=1.000000
k.fex.stack.hot.tbl.frex-only.stats

k008.fex.hot.tbl
k008.fex.hot.tbl.frex-only.cdf

k008.fex.hot.tbl.frex-only.cdf
p(KS test)=0.000000.
Npts=5 Median=7
Mean=7.2
p(t)=1.000000
Std=1.3
p(F)=1.000000
k008.fex.hot.tbl.frex-only.stats

k009.fex.hot.tbl
k009.fex.hot.tbl.frex-only.cdf

k009.fex.hot.tbl.frex-only.cdf
p(KS test)=0.634989.
Npts=4 Median=9.5
Mean=11.5
p(t)=0.308746
Std=5.92
p(F)=0.013588
k009.fex.hot.tbl.frex-only.stats

k010.fex.hot.tbl
k010.fex.hot.tbl.frex-only.cdf

k010.fex.hot.tbl.frex-only.cdf
p(KS test)=0.180606.
Npts=8 Median=10
Mean=12.5
p(t)=0.123539
Std=6.39
p(F)=0.008170
k010.fex.hot.tbl.frex-only.stats

k011.fex.hot.tbl
k011.fex.hot.tbl.frex-only.cdf

k011.fex.hot.tbl.frex-only.cdf
p(KS test)=0.164079.
Npts=4 Median=13.5
Mean=13.2
p(t)=0.244071
Std=6.85
p(F)=0.007841
k011.fex.hot.tbl.frex-only.stats

k012.fex.hot.tbl
k012.fex.hot.tbl.frex-only.cdf

k012.fex.hot.tbl.frex-only.cdf
p(KS test)=0.818621.
Npts=5 Median=6
Mean=7
p(t)=0.925047
Std=4
p(F)=0.051804
k012.fex.hot.tbl.frex-only.stats

k013.fex.hot.tbl
k013.fex.hot.tbl.frex-only.cdf

k013.fex.hot.tbl.frex-only.cdf
p(KS test)=0.779843.
Npts=8 Median=6.5
Mean=8.75
p(t)=0.476391
Std=5.01
p(F)=0.020580
k013.fex.hot.tbl.frex-only.stats

k022.fex.hot.tbl
k022.fex.hot.tbl.frex-only.cdf

k022.fex.hot.tbl.frex-only.cdf
p(KS test)=0.657640.
Npts=7 Median=7
Mean=8.43
p(t)=0.537771
Std=4.28
p(F)=0.037762
k022.fex.hot.tbl.frex-only.stats

k023.fex.hot.tbl
k023.fex.hot.tbl.frex-only.cdf

k023.fex.hot.tbl.frex-only.cdf
p(KS test)=0.808819.
Npts=3 Median=6
Mean=7.67
p(t)=0.863574
Std=3.79
p(F)=0.073520
k023.fex.hot.tbl.frex-only.stats

k024.fex.hot.tbl
k024.fex.hot.tbl.frex-only.cdf

k024.fex.hot.tbl.frex-only.cdf
p(KS test)=0.502914.
Npts=6 Median=5.5
Mean=7
p(t)=0.905524
Std=3.41
p(F)=0.086446
k024.fex.hot.tbl.frex-only.stats

k025.fex.hot.tbl
k025.fex.hot.tbl.frex-only.cdf

k025.fex.hot.tbl.frex-only.cdf
p(KS test)=0.502914.
Npts=6 Median=6.5
Mean=7.67
p(t)=0.814078
Std=4.08
p(F)=0.046099
k025.fex.hot.tbl.frex-only.stats

k026.fex.hot.tbl
k026.fex.hot.tbl.frex-only.cdf

k026.fex.hot.tbl.frex-only.cdf
p(KS test)=0.808819.
Npts=3 Median=9
Mean=8.67
p(t)=0.588002
Std=3.51
p(F)=0.093400
k026.fex.hot.tbl.frex-only.stats

k027.fex.hot.tbl
k027.fex.hot.tbl.frex-only.cdf

k027.fex.hot.tbl.frex-only.cdf
p(KS test)=0.164079.
Npts=4 Median=4
Mean=5.75
p(t)=0.525756
Std=3.5
p(F)=0.086519
k027.fex.hot.tbl.frex-only.stats

k036.fex.hot.tbl
k036.fex.hot.tbl.frex-only.cdf

k036.fex.hot.tbl.frex-only.cdf
p(KS test)=0.634989.
Npts=4 Median=8.5
Mean=9
p(t)=0.451972
Std=3.56
p(F)=0.081892
k036.fex.hot.tbl.frex-only.stats

k037.fex.hot.tbl
k037.fex.hot.tbl.frex-only.cdf

k037.fex.hot.tbl.frex-only.cdf
p(KS test)=0.329105.
Npts=5 Median=14
Mean=11.2
p(t)=0.217938
Std=4.87
p(F)=0.025678
k037.fex.hot.tbl.frex-only.stats

k038.fex.hot.tbl
k038.fex.hot.tbl.frex-only.cdf

k038.fex.hot.tbl.frex-only.cdf
p(KS test)=0.329105.
Npts=5 Median=5
Mean=6
p(t)=0.489246
Std=2.92
p(F)=0.148148
k038.fex.hot.tbl.frex-only.stats

k039.fex.hot.tbl
k039.fex.hot.tbl.frex-only.cdf

k039.fex.hot.tbl.frex-only.cdf
p(KS test)=0.779843.
Npts=8 Median=6.5
Mean=9.62
p(t)=0.380482
Std=6.28
p(F)=0.008754
k039.fex.hot.tbl.frex-only.stats

k040.fex.hot.tbl
k040.fex.hot.tbl.frex-only.cdf

k040.fex.hot.tbl.frex-only.cdf
p(KS test)=
Npts= Median=
Mean=
p(t)=
Std=
p(F)=
k040.fex.hot.tbl.frex-only.stats

k041.fex.hot.tbl
k041.fex.hot.tbl.frex-only.cdf

k041.fex.hot.tbl.frex-only.cdf
p(KS test)=0.114843.
Npts=2 Median=13
Mean=13
p(t)=0.169833
Std=1.41
p(F)=0.678154
k041.fex.hot.tbl.frex-only.stats

k050.fex.hot.tbl
k050.fex.hot.tbl.frex-only.cdf

k050.fex.hot.tbl.frex-only.cdf
p(KS test)=0.818621.
Npts=5 Median=8
Mean=11.4
p(t)=0.288442
Std=6.43
p(F)=0.009131
k050.fex.hot.tbl.frex-only.stats

k051.fex.hot.tbl
k051.fex.hot.tbl.frex-only.cdf

k051.fex.hot.tbl.frex-only.cdf
p(KS test)=0.779843.
Npts=8 Median=7.5
Mean=8.88
p(t)=0.401144
Std=4.42
p(F)=0.032571
k051.fex.hot.tbl.frex-only.stats

k052.fex.hot.tbl
k052.fex.hot.tbl.frex-only.cdf

k052.fex.hot.tbl.frex-only.cdf
p(KS test)=0.329105.
Npts=5 Median=16
Mean=12.2
p(t)=0.240679
Std=6.65
p(F)=0.008027
k052.fex.hot.tbl.frex-only.stats

k053.fex.hot.tbl
k053.fex.hot.tbl.frex-only.cdf

k053.fex.hot.tbl.frex-only.cdf
p(KS test)=0.027528.
Npts=7 Median=17
Mean=16.9
p(t)=0.028691
Std=5.15
p(F)=0.019130
k053.fex.hot.tbl.frex-only.stats

k054.fex.hot.tbl
k054.fex.hot.tbl.frex-only.cdf

k054.fex.hot.tbl.frex-only.cdf
p(KS test)=0.634989.
Npts=4 Median=6.5
Mean=9.5
p(t)=0.599257
Std=7.14
p(F)=0.006693
k054.fex.hot.tbl.frex-only.stats

k055.fex.hot.tbl
k055.fex.hot.tbl.frex-only.cdf

k055.fex.hot.tbl.frex-only.cdf
p(KS test)=0.101960.
Npts=7 Median=10
Mean=10.9
p(t)=0.179431
Std=4.91
p(F)=0.022707
k055.fex.hot.tbl.frex-only.stats

k064.fex.hot.tbl
k064.fex.hot.tbl.frex-only.cdf

k064.fex.hot.tbl.frex-only.cdf
p(KS test)=0.990646.
Npts=8 Median=7.5
Mean=8.38
p(t)=0.578925
Std=4.98
p(F)=0.020940
k064.fex.hot.tbl.frex-only.stats

k066.fex.hot.tbl
k066.fex.hot.tbl.frex-only.cdf

k066.fex.hot.tbl.frex-only.cdf
p(KS test)=0.999965.
Npts=5 Median=7
Mean=6.4
p(t)=0.465478
Std=1.52
p(F)=0.776688
k066.fex.hot.tbl.frex-only.stats

k067.fex.hot.tbl
k067.fex.hot.tbl.frex-only.cdf

k067.fex.hot.tbl.frex-only.cdf
p(KS test)=0.512144.
Npts=4 Median=5.5
Mean=5.75
p(t)=0.314556
Std=1.71
p(F)=0.602044
k067.fex.hot.tbl.frex-only.stats

k069.fex.hot.tbl
k069.fex.hot.tbl.frex-only.cdf

k069.fex.hot.tbl.frex-only.cdf
p(KS test)=0.114843.
Npts=2 Median=22.5
Mean=22.5
p(t)=0.102333
Std=2.12
p(F)=0.358141
k069.fex.hot.tbl.frex-only.stats

k078.fex.hot.tbl
k078.fex.hot.tbl.frex-only.cdf

k078.fex.hot.tbl.frex-only.cdf
p(KS test)=0.502914.
Npts=6 Median=10
Mean=10.8
p(t)=0.263274
Std=5.81
p(F)=0.012612
k078.fex.hot.tbl.frex-only.stats

k079.fex.hot.tbl
k079.fex.hot.tbl.frex-only.cdf

k079.fex.hot.tbl.frex-only.cdf
p(KS test)=0.549326.
Npts=9 Median=6
Mean=7.33
p(t)=0.938113
Std=4.36
p(F)=0.033632
k079.fex.hot.tbl.frex-only.stats

k080.fex.hot.tbl
k080.fex.hot.tbl.frex-only.cdf

k080.fex.hot.tbl.frex-only.cdf
p(KS test)=0.502914.
Npts=6 Median=9
Mean=10.3
p(t)=0.403231
Std=7.34
p(F)=0.005176
k080.fex.hot.tbl.frex-only.stats

k081.fex.hot.tbl
k081.fex.hot.tbl.frex-only.cdf

k081.fex.hot.tbl.frex-only.cdf
p(KS test)=0.657640.
Npts=7 Median=7
Mean=9.71
p(t)=0.309866
Std=4.96
p(F)=0.021979
k081.fex.hot.tbl.frex-only.stats

k082.fex.hot.tbl
k082.fex.hot.tbl.frex-only.cdf

k082.fex.hot.tbl.frex-only.cdf
p(KS test)=0.922332.
Npts=6 Median=8
Mean=8.33
p(t)=0.386217
Std=2.16
p(F)=0.349426
k082.fex.hot.tbl.frex-only.stats

k083.fex.hot.tbl
k083.fex.hot.tbl.frex-only.cdf

k083.fex.hot.tbl.frex-only.cdf
p(KS test)=0.329105.
Npts=5 Median=10
Mean=10.2
p(t)=0.347826
Std=5.36
p(F)=0.018063
k083.fex.hot.tbl.frex-only.stats

k092.fex.hot.tbl
k092.fex.hot.tbl.frex-only.cdf

k092.fex.hot.tbl.frex-only.cdf
p(KS test)=0.181300.
Npts=10 Median=11
Mean=10.9
p(t)=0.103838
Std=4.53
p(F)=0.028649
k092.fex.hot.tbl.frex-only.stats

k093.fex.hot.tbl
k093.fex.hot.tbl.frex-only.cdf

k093.fex.hot.tbl.frex-only.cdf
p(KS test)=0.114844.
Npts=9 Median=12
Mean=12
p(t)=0.091096
Std=5.27
p(F)=0.016639
k093.fex.hot.tbl.frex-only.stats

k094.fex.hot.tbl
k094.fex.hot.tbl.frex-only.cdf

k094.fex.hot.tbl.frex-only.cdf
p(KS test)=0.867426.
Npts=9 Median=6
Mean=7.44
p(t)=0.861412
Std=3.4
p(F)=0.082017
k094.fex.hot.tbl.frex-only.stats

k095.fex.hot.tbl
k095.fex.hot.tbl.frex-only.cdf

k095.fex.hot.tbl.frex-only.cdf
p(KS test)=0.549327.
Npts=9 Median=8
Mean=10.3
p(t)=0.202820
Std=5.32
p(F)=0.016089
k095.fex.hot.tbl.frex-only.stats

k096.fex.hot.tbl
k096.fex.hot.tbl.frex-only.cdf

k096.fex.hot.tbl.frex-only.cdf
p(KS test)=0.101960.
Npts=7 Median=13
Mean=12.7
p(t)=0.132591
Std=6.32
p(F)=0.008819
k096.fex.hot.tbl.frex-only.stats

k097.fex.hot.tbl
k097.fex.hot.tbl.frex-only.cdf

k097.fex.hot.tbl.frex-only.cdf
p(KS test)=0.818621.
Npts=5 Median=6
Mean=7.8
p(t)=0.786799
Std=4.15
p(F)=0.045632
k097.fex.hot.tbl.frex-only.stats

k120.fex.hot.tbl
k120.fex.hot.tbl.frex-only.cdf

k120.fex.hot.tbl.frex-only.cdf
p(KS test)=0.657640.
Npts=7 Median=6
Mean=9.71
p(t)=0.338615
Std=5.38
p(F)=0.016235
k120.fex.hot.tbl.frex-only.stats

k121.fex.hot.tbl
k121.fex.hot.tbl.frex-only.cdf

k121.fex.hot.tbl.frex-only.cdf
p(KS test)=0.502914.
Npts=6 Median=12
Mean=11.7
p(t)=0.217403
Std=6.25
p(F)=0.009572
k121.fex.hot.tbl.frex-only.stats

k122.fex.hot.tbl
k122.fex.hot.tbl.frex-only.cdf

k122.fex.hot.tbl.frex-only.cdf
p(KS test)=0.502914.
Npts=6 Median=11
Mean=11.2
p(t)=0.275766
Std=6.62
p(F)=0.007709
k122.fex.hot.tbl.frex-only.stats

k123.fex.hot.tbl
k123.fex.hot.tbl.frex-only.cdf

k123.fex.hot.tbl.frex-only.cdf
p(KS test)=0.101960.
Npts=7 Median=13
Mean=13.7
p(t)=0.083899
Std=5.82
p(F)=0.012020
k123.fex.hot.tbl.frex-only.stats

k124.fex.hot.tbl
k124.fex.hot.tbl.frex-only.cdf

k124.fex.hot.tbl.frex-only.cdf
p(KS test)=0.990646.
Npts=8 Median=7.5
Mean=8.25
p(t)=0.546146
Std=3.96
p(F)=0.048768
k124.fex.hot.tbl.frex-only.stats

k125.fex.hot.tbl
k125.fex.hot.tbl.frex-only.cdf

k125.fex.hot.tbl.frex-only.cdf
p(KS test)=0.164079.
Npts=4 Median=13.5
Mean=13
p(t)=0.205847
Std=5.72
p(F)=0.015442
k125.fex.hot.tbl.frex-only.stats

k153.fex.hot.tbl
k153.fex.hot.tbl.frex-only.cdf

k153.fex.hot.tbl.frex-only.cdf
p(KS test)=0.375207.
Npts=3 Median=12
Mean=11.3
p(t)=0.350818
Std=5.03
p(F)=0.028004
k153.fex.hot.tbl.frex-only.stats


Last update: 18-Nov-98 (9:39:54), Joe Mazzarella (mazz@ipac.caltech.edu )