Hot Pixel Analysis--- 990926n

NOTE: DO NOT EDIT THIS FILE! It is generated dynamically by software.
Night/hemisphere dataset: 990926n

42 scans (in low density regions) identified for analysis:
s005 s006 s007 s008 s009 s010 s019 s020 s021 s022 s023 s024 s033 s034 s035 s036 s037 s038 s047 s048 s049 s050 s051 s052 s060 s061 s062 s063 s064 s065 s072 s073 s074 s085 s086 s087 s088 s089 s090 s098 s099 s100

Procedures performed are outlined in Data Processing

Results

Figure 1---
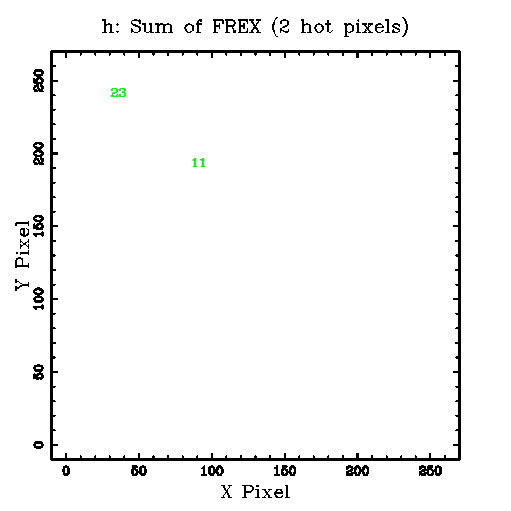
Row 1: The sum (coadd=stack) of 42 FREX (>=4) images. The plotted numbers indicate the sum of the FREX values at each pixel. Links to the FITS images are given below the K, H and J panel.
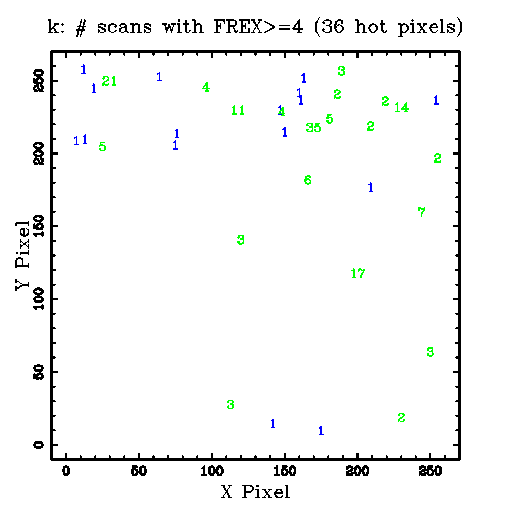
Row 2: The plotted numbers indicate the number of scans (1-42) in which FREX>=4 was found for each hot pixel.
Below the K, H and J panel are links to the corresponding tabular data.

K H J
1) Sum of FREX Images:
Tabular Data
OR mask in Fowler's Format
FITS Image
Tabular Data
OR mask in Fowler's Format
FITS Image
Tabular Data
OR mask in Fowler's Format
FITS Image
2) Scan Counts:
k.scan_cnt.tbl

h.scan_cnt.tbl

j.scan_cnt.tbl


Figure 2---
Histograms, CDFs, and comparison statistics for K-array FREX distributions.

Row 1: Data for the coadd (stack=sum) of 42 FREX (>=4) images.
Following 42 rows: Data for each scan.
Under each CDF plot is a link to the data file, and the p-level for the two-sample KS statistic. After the histogram and CFD plot are rows listing the number of points, median, mean, p-level for the Student's t test for different means, standard deviation, p-level for the F test for different variances, and a link to the original statistics program output file.

Histogram
cdf data file
CDF
cdf data file
p(KS test)
# PointsMedian
Mean
p(t)
Std
p(F)
Statistics file

k.fex.stack.hot.tbl
k.fex.stack.hot.tbl.frex-only.cdf

k.fex.stack.hot.tbl.frex-only.cdf
p(KS test)=0.000000.
Npts=36 Median=18
Mean=39.3
p(t)=1.000000
Std=64.3
p(F)=1.000000
k.fex.stack.hot.tbl.frex-only.stats

k005.fex.hot.tbl
k005.fex.hot.tbl.frex-only.cdf

k005.fex.hot.tbl.frex-only.cdf
p(KS test)=0.000000.
Npts=2 Median=10.5
Mean=10.5
p(t)=1.000000
Std=3.54
p(F)=1.000000
k005.fex.hot.tbl.frex-only.stats

k006.fex.hot.tbl
k006.fex.hot.tbl.frex-only.cdf

k006.fex.hot.tbl.frex-only.cdf
p(KS test)=0.925086.
Npts=3 Median=8
Mean=7.67
p(t)=0.563223
Std=2.52
p(F)=0.590477
k006.fex.hot.tbl.frex-only.stats

k007.fex.hot.tbl
k007.fex.hot.tbl.frex-only.cdf

k007.fex.hot.tbl.frex-only.cdf
p(KS test)=0.690008.
Npts=7 Median=6
Mean=7.86
p(t)=0.549846
Std=3.93
p(F)=0.806852
k007.fex.hot.tbl.frex-only.stats

k008.fex.hot.tbl
k008.fex.hot.tbl.frex-only.cdf

k008.fex.hot.tbl.frex-only.cdf
p(KS test)=0.847488.
Npts=6 Median=7.5
Mean=9
p(t)=0.719879
Std=4.2
p(F)=0.875625
k008.fex.hot.tbl.frex-only.stats

k009.fex.hot.tbl
k009.fex.hot.tbl.frex-only.cdf

k009.fex.hot.tbl.frex-only.cdf
p(KS test)=0.517551.
Npts=6 Median=4.5
Mean=8.17
p(t)=0.647492
Std=6.21
p(F)=0.812466
k009.fex.hot.tbl.frex-only.stats

k010.fex.hot.tbl
k010.fex.hot.tbl.frex-only.cdf

k010.fex.hot.tbl.frex-only.cdf
p(KS test)=0.963945.
Npts=2 Median=8
Mean=8
p(t)=0.619791
Std=1.41
p(F)=0.484476
k010.fex.hot.tbl.frex-only.stats

k019.fex.hot.tbl
k019.fex.hot.tbl.frex-only.cdf

k019.fex.hot.tbl.frex-only.cdf
p(KS test)=0.999342.
Npts=3 Median=11
Mean=10.7
p(t)=0.973135
Std=4.51
p(F)=0.969762
k019.fex.hot.tbl.frex-only.stats

k020.fex.hot.tbl
k020.fex.hot.tbl.frex-only.cdf

k020.fex.hot.tbl.frex-only.cdf
p(KS test)=0.999997.
Npts=4 Median=10.5
Mean=10.5
p(t)=1.000000
Std=5.32
p(F)=0.891910
k020.fex.hot.tbl.frex-only.stats

k021.fex.hot.tbl
k021.fex.hot.tbl.frex-only.cdf

k021.fex.hot.tbl.frex-only.cdf
p(KS test)=0.660386.
Npts=3 Median=6
Mean=7.67
p(t)=0.629469
Std=4.73
p(F)=0.935219
k021.fex.hot.tbl.frex-only.stats

k022.fex.hot.tbl
k022.fex.hot.tbl.frex-only.cdf

k022.fex.hot.tbl.frex-only.cdf
p(KS test)=0.682550.
Npts=5 Median=6
Mean=8
p(t)=0.591007
Std=4
p(F)=0.853372
k022.fex.hot.tbl.frex-only.stats

k023.fex.hot.tbl
k023.fex.hot.tbl.frex-only.cdf

k023.fex.hot.tbl.frex-only.cdf
p(KS test)=0.999997.
Npts=4 Median=11
Mean=12.8
p(t)=0.751751
Std=8.81
p(F)=0.569976
k023.fex.hot.tbl.frex-only.stats

k024.fex.hot.tbl
k024.fex.hot.tbl.frex-only.cdf

k024.fex.hot.tbl.frex-only.cdf
p(KS test)=
Npts= Median=
Mean=
p(t)=
Std=
p(F)=
k024.fex.hot.tbl.frex-only.stats

k033.fex.hot.tbl
k033.fex.hot.tbl.frex-only.cdf

k033.fex.hot.tbl.frex-only.cdf
p(KS test)=0.892778.
Npts=4 Median=9.5
Mean=9.5
p(t)=0.822865
Std=4.2
p(F)=0.924037
k033.fex.hot.tbl.frex-only.stats

k034.fex.hot.tbl
k034.fex.hot.tbl.frex-only.cdf

k034.fex.hot.tbl.frex-only.cdf
p(KS test)=0.999342.
Npts=3 Median=13
Mean=11.7
p(t)=0.830914
Std=5.13
p(F)=0.875936
k034.fex.hot.tbl.frex-only.stats

k035.fex.hot.tbl
k035.fex.hot.tbl.frex-only.cdf

k035.fex.hot.tbl.frex-only.cdf
p(KS test)=0.963945.
Npts=2 Median=6.5
Mean=6.5
p(t)=0.528189
Std=2.12
p(F)=0.688083
k035.fex.hot.tbl.frex-only.stats

k036.fex.hot.tbl
k036.fex.hot.tbl.frex-only.cdf

k036.fex.hot.tbl.frex-only.cdf
p(KS test)=0.925086.
Npts=3 Median=11
Mean=11.7
p(t)=0.770901
Std=2.08
p(F)=0.463053
k036.fex.hot.tbl.frex-only.stats

k037.fex.hot.tbl
k037.fex.hot.tbl.frex-only.cdf

k037.fex.hot.tbl.frex-only.cdf
p(KS test)=0.925086.
Npts=3 Median=9
Mean=8.33
p(t)=0.649845
Std=3.06
p(F)=0.733399
k037.fex.hot.tbl.frex-only.stats

k038.fex.hot.tbl
k038.fex.hot.tbl.frex-only.cdf

k038.fex.hot.tbl.frex-only.cdf
p(KS test)=0.999524.
Npts=5 Median=10
Mean=10
p(t)=0.897189
Std=3.39
p(F)=0.712021
k038.fex.hot.tbl.frex-only.stats

k047.fex.hot.tbl
k047.fex.hot.tbl.frex-only.cdf

k047.fex.hot.tbl.frex-only.cdf
p(KS test)=0.867426.
Npts=5 Median=10
Mean=8.4
p(t)=0.611717
Std=2.7
p(F)=0.521609
k047.fex.hot.tbl.frex-only.stats

k048.fex.hot.tbl
k048.fex.hot.tbl.frex-only.cdf

k048.fex.hot.tbl.frex-only.cdf
p(KS test)=0.682550.
Npts=5 Median=7
Mean=9
p(t)=0.752743
Std=5.34
p(F)=0.911980
k048.fex.hot.tbl.frex-only.stats

k049.fex.hot.tbl
k049.fex.hot.tbl.frex-only.cdf

k049.fex.hot.tbl.frex-only.cdf
p(KS test)=0.999342.
Npts=3 Median=8
Mean=10.3
p(t)=0.981106
Std=7.77
p(F)=0.612756
k049.fex.hot.tbl.frex-only.stats

k050.fex.hot.tbl
k050.fex.hot.tbl.frex-only.cdf

k050.fex.hot.tbl.frex-only.cdf
p(KS test)=0.319954.
Npts=5 Median=5
Mean=6.2
p(t)=0.391064
Std=1.79
p(F)=0.238578
k050.fex.hot.tbl.frex-only.stats

k051.fex.hot.tbl
k051.fex.hot.tbl.frex-only.cdf

k051.fex.hot.tbl.frex-only.cdf
p(KS test)=0.996255.
Npts=6 Median=10.5
Mean=12.7
p(t)=0.664164
Std=6.06
p(F)=0.830696
k051.fex.hot.tbl.frex-only.stats

k052.fex.hot.tbl
k052.fex.hot.tbl.frex-only.cdf

k052.fex.hot.tbl.frex-only.cdf
p(KS test)=0.319954.
Npts=5 Median=6
Mean=7.6
p(t)=0.596474
Std=5.9
p(F)=0.837506
k052.fex.hot.tbl.frex-only.stats

k060.fex.hot.tbl
k060.fex.hot.tbl.frex-only.cdf

k060.fex.hot.tbl.frex-only.cdf
p(KS test)=0.682550.
Npts=5 Median=6
Mean=6.6
p(t)=0.438283
Std=2.97
p(F)=0.598411
k060.fex.hot.tbl.frex-only.stats

k061.fex.hot.tbl
k061.fex.hot.tbl.frex-only.cdf

k061.fex.hot.tbl.frex-only.cdf
p(KS test)=0.925086.
Npts=3 Median=8
Mean=8
p(t)=0.583906
Std=2
p(F)=0.438262
k061.fex.hot.tbl.frex-only.stats

k062.fex.hot.tbl
k062.fex.hot.tbl.frex-only.cdf

k062.fex.hot.tbl.frex-only.cdf
p(KS test)=0.892778.
Npts=4 Median=8
Mean=9.25
p(t)=0.779226
Std=4.03
p(F)=0.890042
k062.fex.hot.tbl.frex-only.stats

k063.fex.hot.tbl
k063.fex.hot.tbl.frex-only.cdf

k063.fex.hot.tbl.frex-only.cdf
p(KS test)=0.660386.
Npts=3 Median=6
Mean=7
p(t)=0.537875
Std=3.61
p(F)=0.860394
k063.fex.hot.tbl.frex-only.stats

k064.fex.hot.tbl
k064.fex.hot.tbl.frex-only.cdf

k064.fex.hot.tbl.frex-only.cdf
p(KS test)=0.999342.
Npts=3 Median=9
Mean=11.3
p(t)=0.886469
Std=5.86
p(F)=0.784867
k064.fex.hot.tbl.frex-only.stats

k065.fex.hot.tbl
k065.fex.hot.tbl.frex-only.cdf

k065.fex.hot.tbl.frex-only.cdf
p(KS test)=0.963945.
Npts=2 Median=11
Mean=11
p(t)=0.916769
Std=2.83
p(F)=0.859107
k065.fex.hot.tbl.frex-only.stats

k072.fex.hot.tbl
k072.fex.hot.tbl.frex-only.cdf

k072.fex.hot.tbl.frex-only.cdf
p(KS test)=0.441306.
Npts=4 Median=5
Mean=6.25
p(t)=0.442120
Std=3.3
p(F)=0.726066
k072.fex.hot.tbl.frex-only.stats

k073.fex.hot.tbl
k073.fex.hot.tbl.frex-only.cdf

k073.fex.hot.tbl.frex-only.cdf
p(KS test)=0.892778.
Npts=4 Median=6.5
Mean=8
p(t)=0.616759
Std=4.24
p(F)=0.931596
k073.fex.hot.tbl.frex-only.stats

k074.fex.hot.tbl
k074.fex.hot.tbl.frex-only.cdf

k074.fex.hot.tbl.frex-only.cdf
p(KS test)=0.999342.
Npts=3 Median=13
Mean=11
p(t)=0.926732
Std=5.29
p(F)=0.854358
k074.fex.hot.tbl.frex-only.stats

k085.fex.hot.tbl
k085.fex.hot.tbl.frex-only.cdf

k085.fex.hot.tbl.frex-only.cdf
p(KS test)=0.925086.
Npts=3 Median=8
Mean=7.67
p(t)=0.563223
Std=2.52
p(F)=0.590477
k085.fex.hot.tbl.frex-only.stats

k086.fex.hot.tbl
k086.fex.hot.tbl.frex-only.cdf

k086.fex.hot.tbl.frex-only.cdf
p(KS test)=0.099562.
Npts=6 Median=5
Mean=4.83
p(t)=0.303916
Std=0.753
p(F)=0.010706
k086.fex.hot.tbl.frex-only.stats

k087.fex.hot.tbl
k087.fex.hot.tbl.frex-only.cdf

k087.fex.hot.tbl.frex-only.cdf
p(KS test)=0.441306.
Npts=4 Median=5.5
Mean=5.75
p(t)=0.385995
Std=2.06
p(F)=0.369715
k087.fex.hot.tbl.frex-only.stats

k088.fex.hot.tbl
k088.fex.hot.tbl.frex-only.cdf

k088.fex.hot.tbl.frex-only.cdf
p(KS test)=0.892778.
Npts=4 Median=13
Mean=11.5
p(t)=0.846723
Std=5.74
p(F)=0.836414
k088.fex.hot.tbl.frex-only.stats

k089.fex.hot.tbl
k089.fex.hot.tbl.frex-only.cdf

k089.fex.hot.tbl.frex-only.cdf
p(KS test)=0.114843.
Npts=5 Median=6
Mean=5.8
p(t)=0.360339
Std=1.1
p(F)=0.064104
k089.fex.hot.tbl.frex-only.stats

k090.fex.hot.tbl
k090.fex.hot.tbl.frex-only.cdf

k090.fex.hot.tbl.frex-only.cdf
p(KS test)=0.405458.
Npts=7 Median=6
Mean=7
p(t)=0.446717
Std=2.89
p(F)=0.533140
k090.fex.hot.tbl.frex-only.stats

k098.fex.hot.tbl
k098.fex.hot.tbl.frex-only.cdf

k098.fex.hot.tbl.frex-only.cdf
p(KS test)=0.996255.
Npts=6 Median=9.5
Mean=9
p(t)=0.717231
Std=4.05
p(F)=0.845163
k098.fex.hot.tbl.frex-only.stats

k099.fex.hot.tbl
k099.fex.hot.tbl.frex-only.cdf

k099.fex.hot.tbl.frex-only.cdf
p(KS test)=0.441306.
Npts=4 Median=4
Mean=5
p(t)=0.349147
Std=2
p(F)=0.350520
k099.fex.hot.tbl.frex-only.stats

k100.fex.hot.tbl
k100.fex.hot.tbl.frex-only.cdf

k100.fex.hot.tbl.frex-only.cdf
p(KS test)=0.270000.
Npts=2 Median=5.5
Mean=5.5
p(t)=0.478222
Std=2.12
p(F)=0.688083
k100.fex.hot.tbl.frex-only.stats


Last update: 4-Oct-99 (14:27:20), Joe Mazzarella (mazz@ipac.caltech.edu )