k001.hotpix.tbl
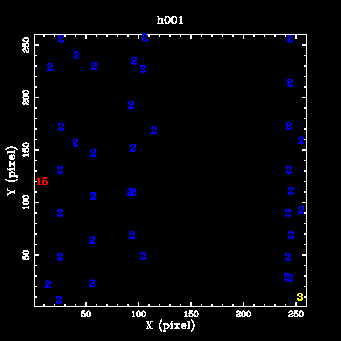
h001.hotpix.tbl
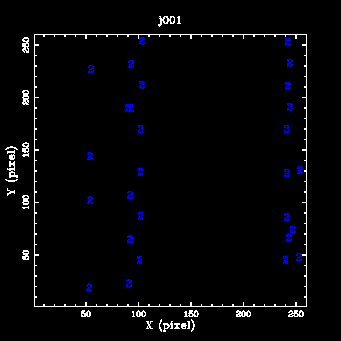
j001.hotpix.tbl
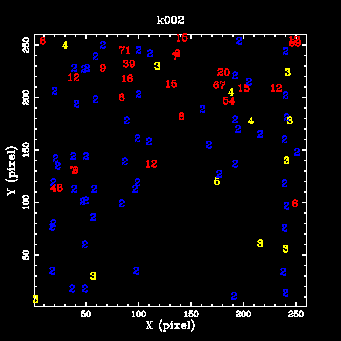
k002.hotpix.tbl
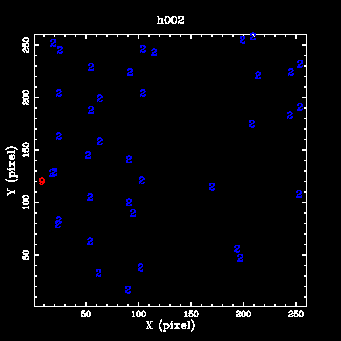
h002.hotpix.tbl
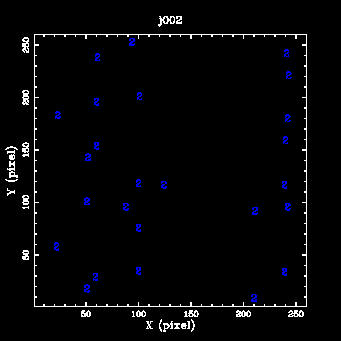
j002.hotpix.tbl
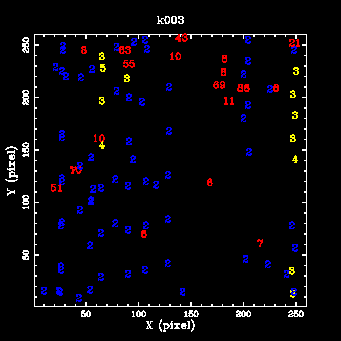
k003.hotpix.tbl
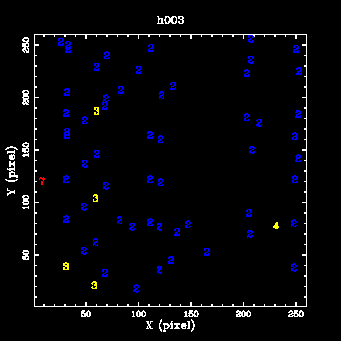
h003.hotpix.tbl
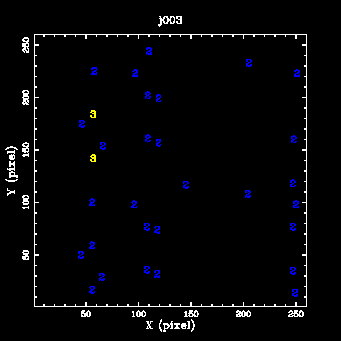
j003.hotpix.tbl
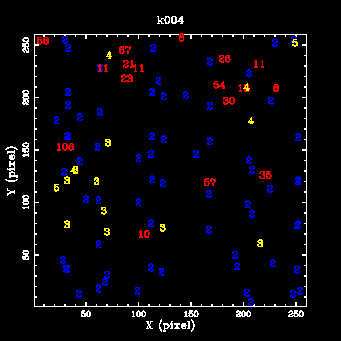
k004.hotpix.tbl
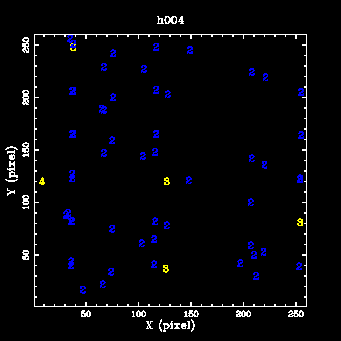
h004.hotpix.tbl
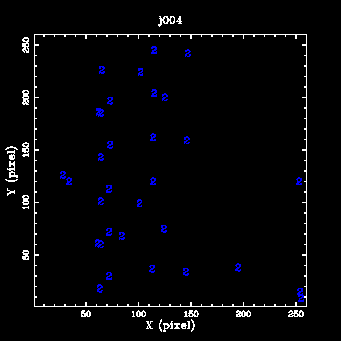
j004.hotpix.tbl
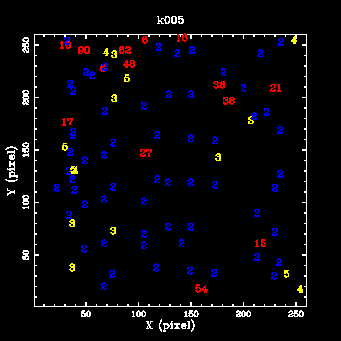
k005.hotpix.tbl
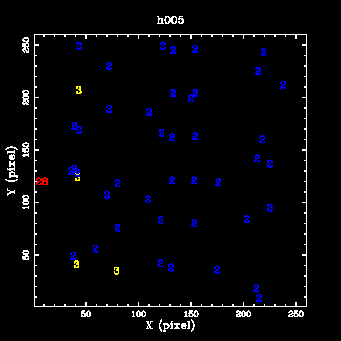
h005.hotpix.tbl
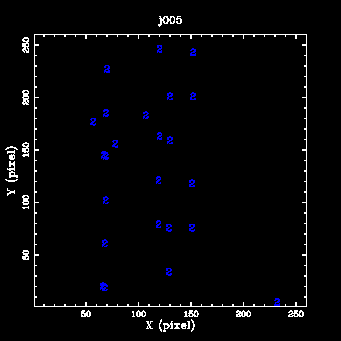
j005.hotpix.tbl
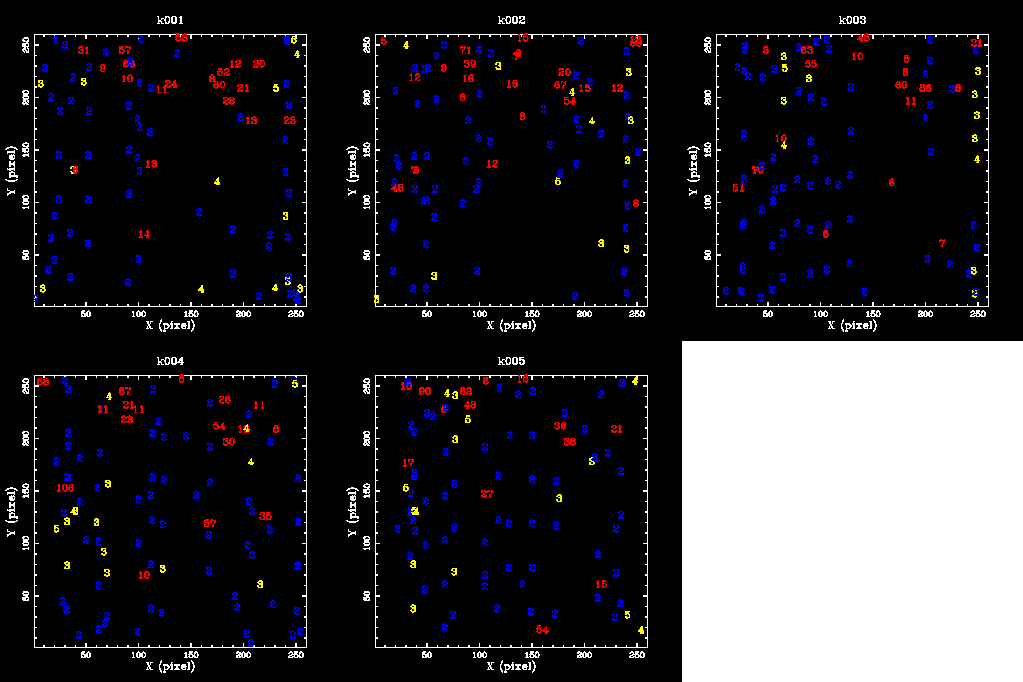
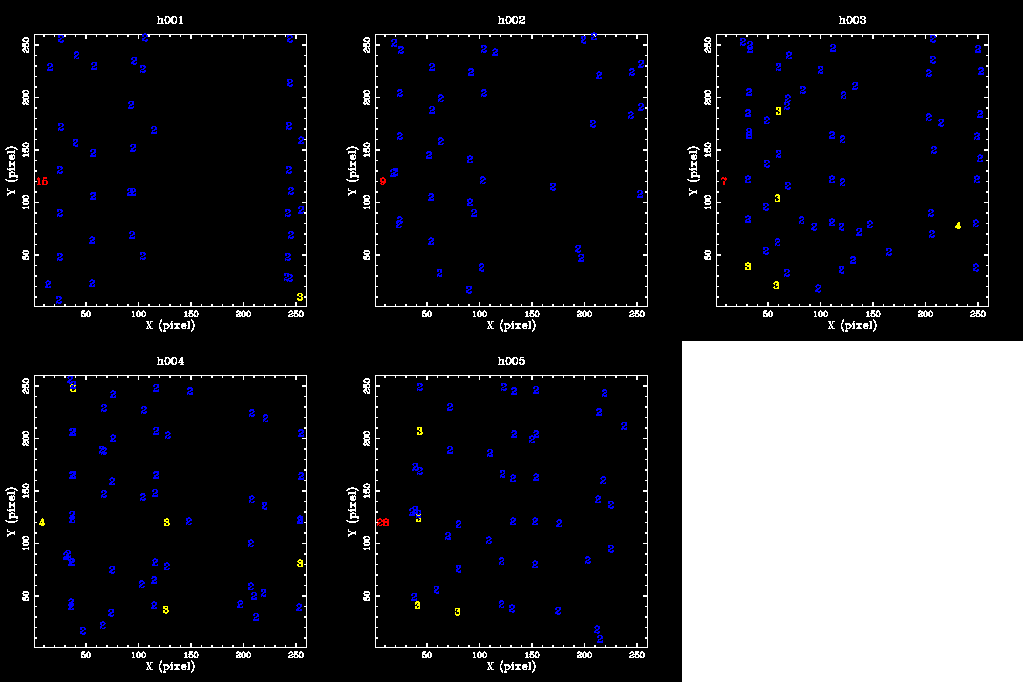
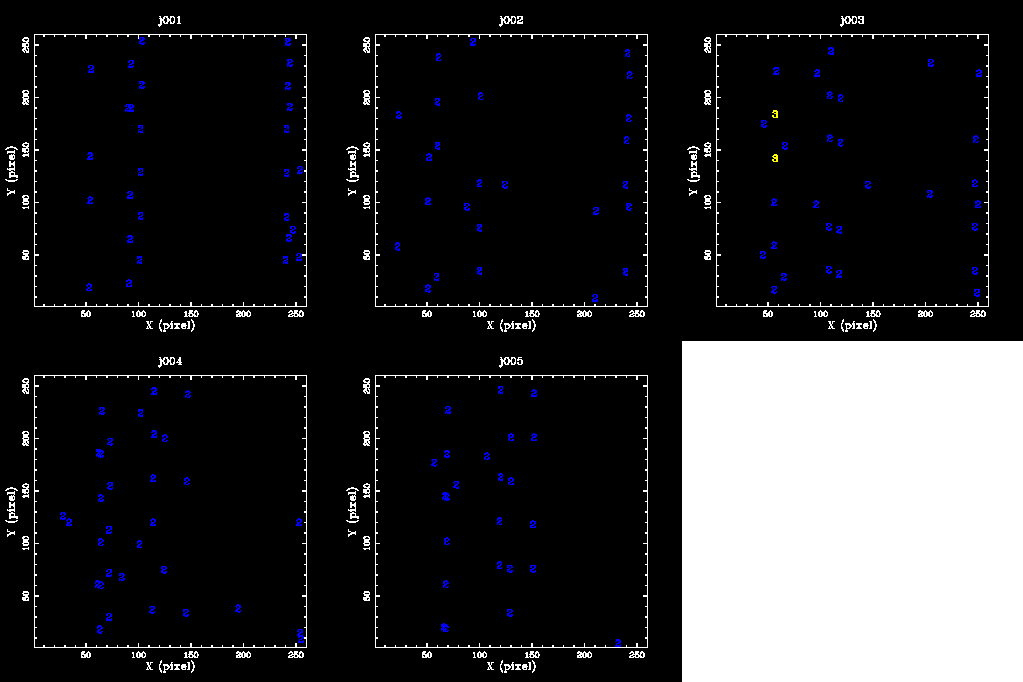
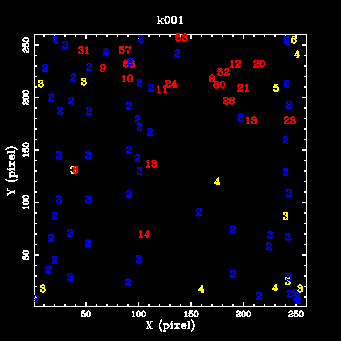
The first row of panels contains movies of scan 001-005 FEX results for bands K, H and J, for efficient scan-to-scan comparison. The following 4 rows are FEX plots for each individual scan and band; these are the frames of the corresponding movies in the first row. Pixels with only 2 frame extractions in a scan are plotted in blue. Pixels with 3-5 frame extractions are plotted in yellow and jump out as potential "warm pixels". Pixels with 6 or more extractions are plotted in red to represent "hot pixel" candidates. Below each individual plot is a link to the tabular data file which is plotted (after thresholding), for example, k001.hotpix.tbl.
| K | H | J | |
| Movie of scans 1-5: |  |
 |
 |
| S001 |  k001.hotpix.tbl |
 h001.hotpix.tbl |
 j001.hotpix.tbl |
| S002 |  k002.hotpix.tbl |
 h002.hotpix.tbl |
 j002.hotpix.tbl |
| S003 |  k003.hotpix.tbl |
 h003.hotpix.tbl |
 j003.hotpix.tbl |
| S004 |  k004.hotpix.tbl |
 h004.hotpix.tbl |
 j004.hotpix.tbl |
| S005 |  k005.hotpix.tbl |
 h005.hotpix.tbl |
 j005.hotpix.tbl |