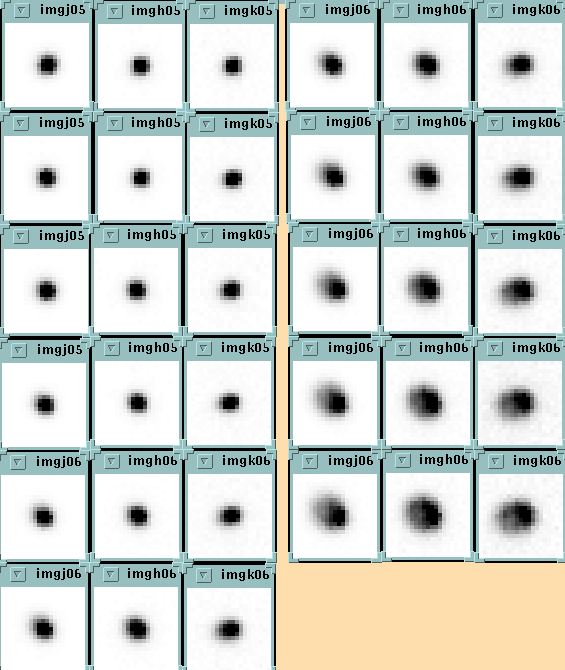
A series of twelve one-degree scans were obtained at the northern 2MASS telescope on the night of 971023 UT to test telescope focus. These tests are of particular interests because the telescope temperatures were considerably cooler (4-5 C) than have been enountered earlier. Thus, additional data can be gathered for the TCS focus control. The scans were made using focus settings between -9500 and -9615. One additional scan was made with the setting returned to -9615.
As is done for all scans in 2MAPPS, composite point source 'psf' images were constructed for the focus test observations. Figure 1 shows a montage of the 'psf' images for scans 056-067. J, H and Ks images are shown along each row. Scans 056-061 (top to botton) are shown on the left and scans 062-067 (top to bottom) on the right. The psf images for scan 068 appear identical to those in scan 057, and are not shown. From these composite images, basic two-dimensional shape information is derived.
Table 1 contains the measured image information for each scan, along with the telescope temperature (Tel_T) and focus setting. Jrat2, Hrat2 and Krat2 are the image second moment ratios, Jba, Hba and Kba are the axial ratios, and Jsh, Hsh and Ksh are the image 'shape' parameters.
Scn Jrat2 Hrat2 Krat2  Jba   Hba   Kba   Jsh   Hsh   Ksh  Tel_T Focus
---------------------------------------------------------------------
056 0.999 0.990 0.988 0.850 0.770 0.770 1.020 0.990 0.955 4.70  -9500
057 1.013 0.999 1.071 0.850 0.900 0.900 0.987 0.974 0.953 4.80  -9516
058 0.997 1.000 1.082 0.950 0.850 0.770 1.018 1.003 0.990 4.80  -9530
059 1.009 1.006 1.144 0.850 0.850 0.850 0.997 1.005 0.985 4.90  -9545
060 1.007 1.019 1.148 0.970 0.950 0.770 1.052 1.060 1.050 4.90  -9560
061 0.999 1.014 1.276 0.900 1.000 0.570 1.094 1.104 1.102 4.90  -9575
062 1.016 1.109 1.306 0.770 0.750 0.520 1.129 1.151 1.164 4.90  -9590
063 1.129 1.117 1.289 0.700 0.750 0.600 1.194 1.212 1.241 4.90  -9605
064 1.012 1.118 1.281 0.820 0.670 0.570 1.239 1.249 1.292 4.90  -9620
065 1.111 1.124 1.270 0.670 0.750 0.550 1.300 1.334 1.338 5.00  -9635
066 1.077 1.097 1.313 0.650 0.720 0.450 1.414 1.452 1.497 5.10  -9650
067 0.984 1.086 1.254 0.520 0.670 0.450 1.512 1.534 1.586 5.00  -9665
068 1.012 1.010 1.061 0.920 0.820 0.770 1.023 0.997 0.973 5.00  -9515
Figure 2 shows the second image moment ratios and the image axial ratios for each scan, along with the seeing 'shape' parameter derived by SEEMAN (a 1-d parameter). J band is indicated in blue, H band in green, and Ks in red.
One sees immediately from the images and the plot that the run of focus used during the test was not symmetric about best focus. The focus appears good during the first couple of scans, but we cannot be certain that the shape could have gotten any smaller. The moment ratios in these scans do not deviate from unity with changes in focus as quickly as observed on other nights, even though the images clearly show elongation. Some of this is due to the fact that the J and H images are elongating at a 45 deg. position angle, where the image moment ratio is insensitive. The seeing shape clearly shows that the image FWHM are larger, though.
Using the combination of moment ratios and shapes, the best focus
appears to have been reached in scan 057, with a setting of -9516.
However, without seeing the image behavior at larger (>-9500) values,
this conclusion remains slightly incertain.