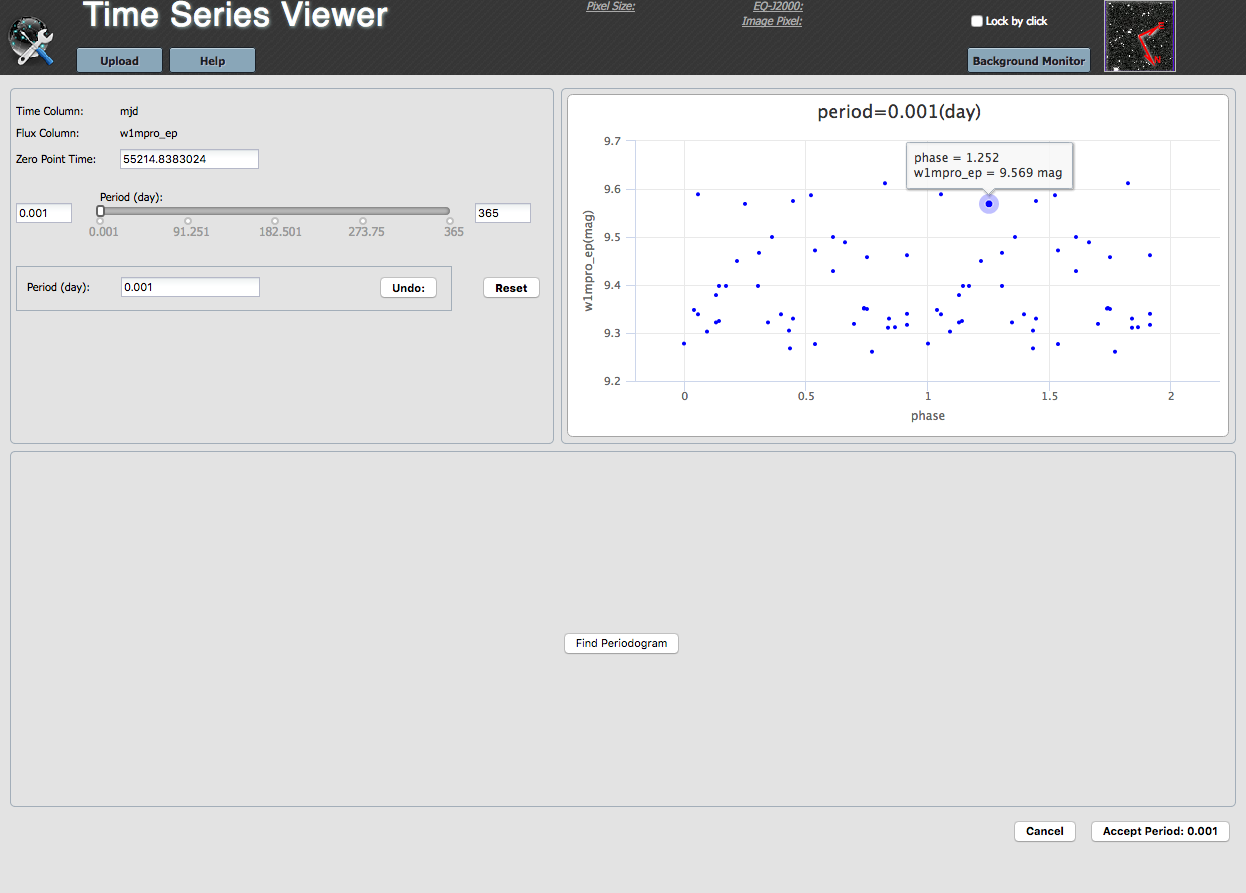
The upper left is another pane, and the upper right is
a plot of the light curve, phased to a period of 0.001 day.
Now we describe these portions of the screen, as well as what to do
next.
It has extracted the time of the first epoch in your data file and
listed it in the box labeled "Zero Point Time." You can change this if
you want.
The slider. The slider is the next item in the
settings pane. This slider can be confusing, but is also very
powerful. The boxes on the far left and right of the slider control
the range over which the slider applies. By default, it comes up with
0.001 d and 365 d. If your target has, say, a period near 0.7 d, but
you are not sure what it is, you can reset the slider limits to be 0.5
and 1 d, then click and drag the slider slowly through the various
periods. The plot of the phased light curve in the
upper right changes dynamically as you move the slider.
The period listed in the box below the slider is the period currently
being used in the plot of the phased light curve.
You can also type values into this box and have the plot and the
slider dynamically update.
The 'undo' button returns the plot to the most recently entered
period. The 'reset' button returns to the most recently accepted period.
Settings and Adjusting Periods
The settings pane carries with it the time and dependent variable
columns you set in the prior screen. These
columns cannot be changed from here; you must return to the main screen to change them.Plots
The plot in the upper right is a plot of the uploaded light curve,
phased to the currently selected period. It comes up with an initial
period of 0.001 d, but if you type a different period in the settings pane, or select it via the slider, then
this plot dynamically updates.
This plot is unlike any other plot within this tool in that you cannot control what is plotted or how.
Clicking on the button brings up this configuration pop-up:
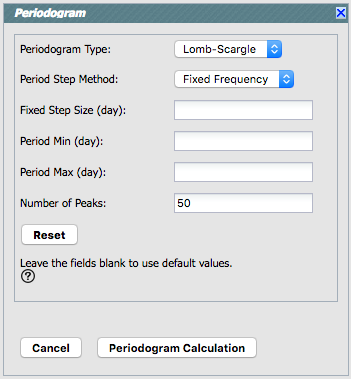
From here, you can select from pull-down menus:
Finally, you can specify the number of periodogram peaks returned in a table. The default is 50.
Click on 'reset' to reset the parameters to the defaults.
Click on 'cancel' to close the pop-up without doing anything.
Click on 'Periodogram Calculation' to initiate the calculation.
After a periodogram calculation has been completed, the "Calculate Periodogram" button moves to the upper left of the results pane.
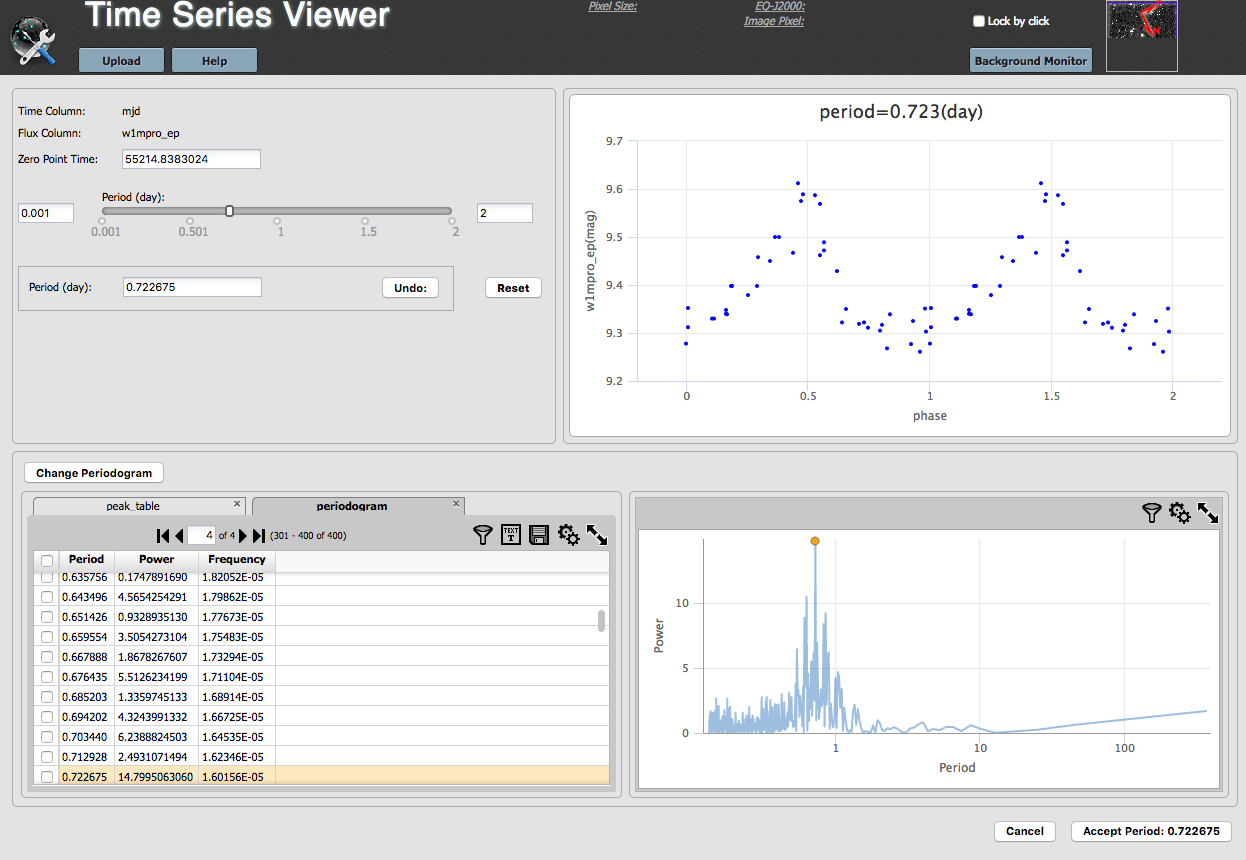
On the left, the two tables are (1) a table listing just the top N peaks, where N is a value you specify in the periodogram finding pop-up (the default is 50); and (2) the periodogram itself (which is in the foreground by default).
On the right, the periodogram is plotted. This is a plot with all the
same basic functionality provided by
this tool in that you can change what and how it is plotted -- for
example, if you want lines connecting the points, click on the gears
( ) to bring up options for the table
and choose a different plot option from the pop-up.
) to bring up options for the table
and choose a different plot option from the pop-up.
The plots and tables are dynamically linked. If you click a point in the periodogram, the row is highlighted in the table, and the phased light curve changes. In the settings pane, the slider also changes, as does the period in the box.
If you select the table of peaks on the left, all the same functionalities apply, except the plot on the lower right is now power versus peak number.
The buttons in the lower right now read "cancel" and "accept period", with the period that you have selected now indicated in the button. 'Cancel' closes the period-finding window without doing anything further. 'Accept period' takes that period as the best possible period, and returns you to the main screen, but now that screen is a little different, because it is after Period Finding.
Go back to Main Screen, Initial View or go on to Main Screen, After Period Finding.