Contents:
+Settings
+Table
+Plot
+Images
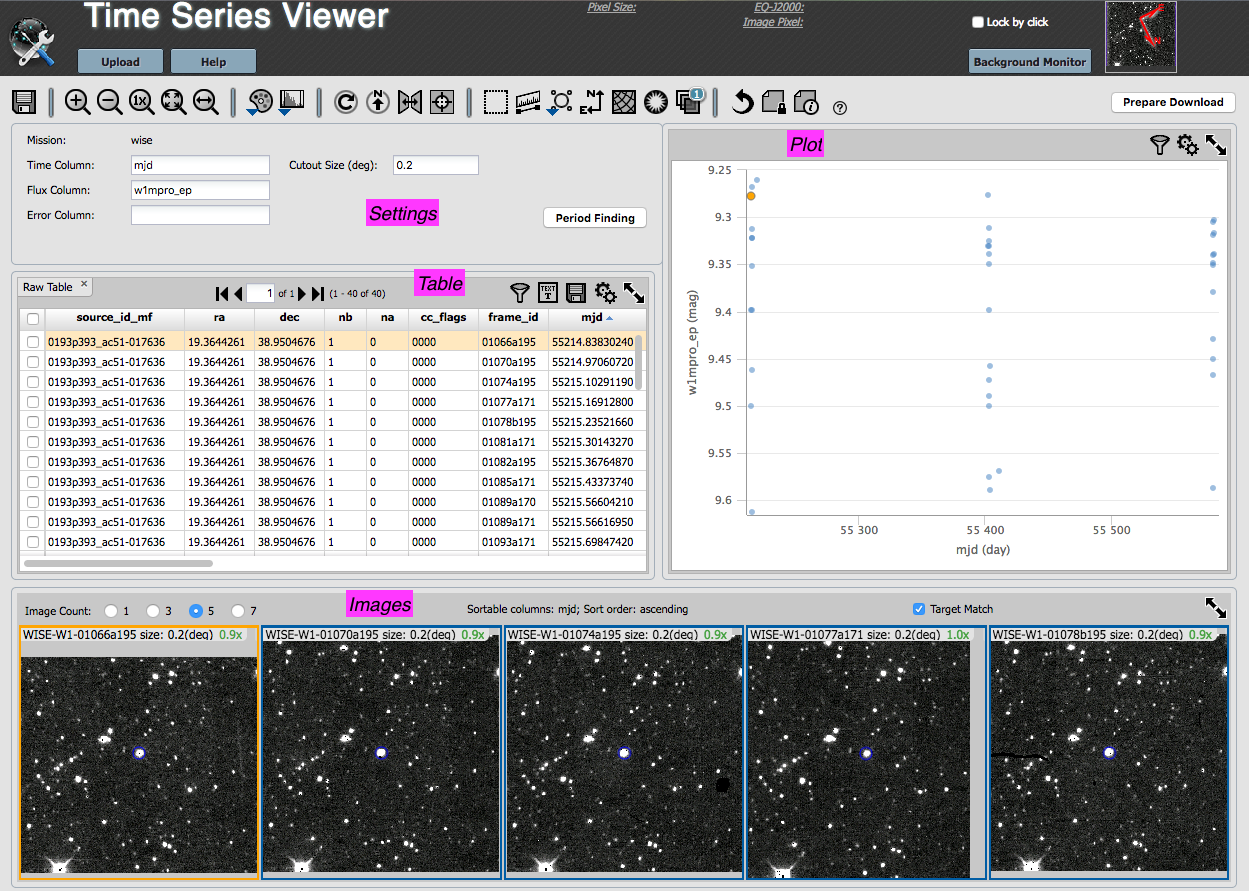
For WISE time series, it assumes that the time column you want is "mjd", and the time-dependent variable column is "w1mpro_ep". You can change this to any of the other 3 WISE channels (w2mpro_ep, w3mpro_ep, w4mpro_ep) and still retain full functionality.
If you have uploaded your own time series, you can control which columns are plotted (and eventually sent to the period-finding function) from this settings pane.
For WISE time series, it will pull images for each epoch of the time series and place them at the bottom of the window (see images, below). The "cutout size" controls the size of these image cutouts.
Finally, the "Period Finding" button launches period finding; see Period Finding.
The basic functionality of this table is identical to that of other IRSA tools with this look-and-feel. The table, if very long, is divided into 'pages' you can scroll through. You can filter and sort the table. You can control which columns are shown. For a more complete introduction to this tool's table manipulation functions, please see the Catalogs section on columns and filters from the main IRSA Viewer section.
Quick start: Sorting. Click on any column heading to sort the table by that column in ascending order; click it again to make it descending order, or click it a 3rd time to return the table to the unsorted state.
The table comes up, by default, sorted by the time column you have selected in the settings pane.
After you run Period Finding, there will be another table loaded in to this pane. See the section on main screen, after period finding.
The basic functionality of this table is identical to that of other IRSA tools with this look-and-feel. You can change what is plotted and how it is plotted. You can add error bars.
For a more general introduction to this tool's plotting functions, please see the Catalogs section on making x-y plots from the main IRSA Viewer section of this document.
Quick start: Adding errors. To add error bars to the
plot of the light curve, click on the gears ( ) to bring up options for the table:
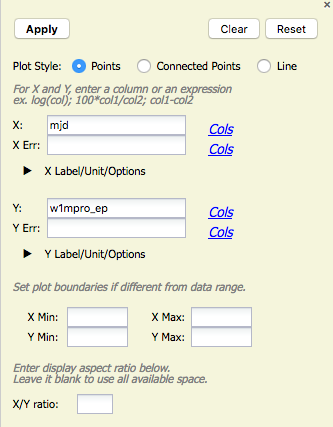
From here, you can tell it which column of your catalog to use for the error bars.
"Apply" to implement your changes, "clear" to empty all the parameters, and "reset" to reset all the parameters to defaults. Click on the 'x' in the upper right to remove this pop-up.
The images are dynamically linked to the table and the plot. Click on a row of the table, and the images (and plot) change; the image in the center of the row of 5 corresponds to the table row you have selected. Click on a point in the plot, and images (and table) change; the image in the center of the row of 5 corresponds to the plot point you have selected. If you change the sort order of the table to, say, sort by brightness, then the order of the images also changes. (This will become more important after you run Period Finding.)
The text immediately above the images reminds you how you have sorted the table, and whether it is ascending or descending.
You can control whether 1, 3, 5, or 7 images are displayed in the sequence.
By default, the tool loads with each image centered on your target. Some targets are on the edge of WISE exposures, so the image may not fill the entire image box for each epoch. To turn this feature off, unclick the "Target Match" box near the upper right of the images pane.
The basic functionality of these images are identical to that of other IRSA tools with this look-and-feel. You are interacting with the FITS files, so you can change the color table and stretch, measure distances, etc.
For a more general introduction to this tool's image manipulations functions, please see the Visualization section from the main IRSA Viewer section of this document.
Quick start: Changing the color table or stretch. To
change the color table, go up to the image toolbar near the top of the
window. Click on the color table icon ( )
and select a new color table from the options presented. Similarly,
for the color stretch, click on the color stretch icon (
)
and select a new color table from the options presented. Similarly,
for the color stretch, click on the color stretch icon ( ) and select a new color stretch from the
options presented.
) and select a new color stretch from the
options presented.
Go back to loading a time series or go on to Period Finding.