2MASS "Hot-Pixel" Analysis: Over All Summary for 970418n, 970423n, and 970521n
2MASS "Hot-Pixel" Analysis: Over All Summary for 970418n, 970423n, and 970521n
The good news is a clear improvement between the number of hot pixels
on nights 970423n (34 in the OR mask) and 970521n (33 in the OR mask)
compared to 970418n (89 in the OR mask). This may be a
characteristic of stabalization ("shake-down") of the electronics,
perhaps related to an instrument shut-down/warm-up between 970418n
and 970423n. However, the bad news is a general lack of commonality
or consistency between specific hot pixels among the 3 nights
examined to date. So far 144 unique K-array pixels have appeared
hot; the number of new pixels observed to have FREX>=4 events has
grown with each night examined; only 12 (8%) of the hot pixels are in
common between any 2 of the 3 nights; no pixel has been found to be
consistently hot across all 3 nights (that is, appearing in all 3 OR
masks); and there is 1 pixel hot in all 20 examined K scans on
970521n (no AND mask for 970423n).
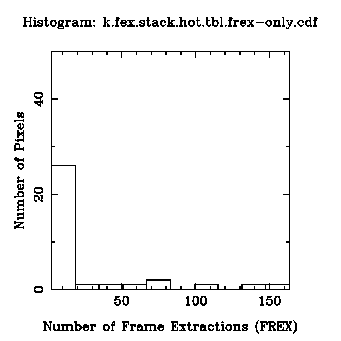
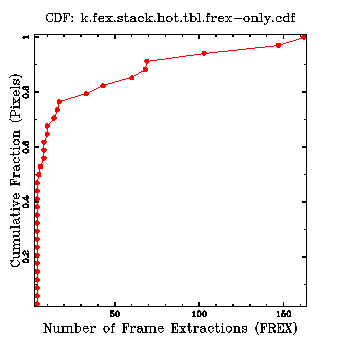
Also, as shown in Figure 1, dispite a similar number of hot pixels,
the FREX distributions for the 2 later nights are different, with
significantly higher FREX events on 970521n compared to 970423n (at
the p~0.05 significance level). Note that the scales are not the
same in these plots, taken from the reports for 970423n and 970521n:
Figure 1--- Comparison of Coadd (Stack) FREX Distributions for 970423n and 970521n
970423n: npts=34 mean=25, median=5.5, var.=1.65e+03, std=40.7
970521n: npts=33 mean=95.4, median=25, var.=3.74e+04, std=193

Student's t statistic = -2.046820.
Significance level for significantly different means = 0.057208
F-test statistic = 22.628813.
Significance level for significantly different variances = 0.000000
K-S statistic=0.340463.
Sig. level for H_o: data sets drawn from same distribution = 0.041206.
This is all a little worrisome and worth watching...
Last update: 06-Jun-97, Joe Mazzarella
(mazz@ipac.caltech.edu )


