Hot Pixel Analysis--- Cumulative Results for J Cal Scans

NOTE: DO NOT EDIT THIS FILE! It is generated dynamically by software (merge_masks).

Night# Hot Pixels (OR mask) # New Hot Pixels Cumulative # Hot Pixels to Date
970424n 0 0 0
970519n 0 0 0
970521n 1 1 1
970523n 0 0 1
970524n 0 0 1
970525n 0 0 1
970526n 0 0 1
970527n 1 0 1
970528n 1 0 1
970529n 0 0 1
970530n 1 0 1
970531n 0 0 1
970602n 0 0 1
970603n 0 0 1
970604n 0 0 1
970605n 0 0 1
970606n 0 0 1
970607n 0 0 1
970608n 1 1 2
970609n 1 1 3
970610n 1 0 3
970611n 0 0 3
970612n 0 0 3
970613n 1 0 3
970614n 0 0 3
970615n 0 0 3
970616n 0 0 3
970617n 0 0 3
970618n 1 0 3
970619n 1 0 3
970620n 0 0 3
970621n 0 0 3
970622n 1 1 4
970624n 0 0 4
970625n 1 0 4
970626n 0 0 4
970627n 0 0 4
970628n 2 2 6
970629n 0 0 6
970630n 1 0 6
970631n 1 0 6
970702n 2 1 7
970703n 1 0 7
970704n 0 0 7
970705n 0 0 7
970706n 0 0 7
970707n 0 0 7
970708n 0 0 7
970709n 0 0 7
970711n 1 1 8
970712n 0 0 8
970713n 1 0 8
970714n 0 0 8
970715n 0 0 8
970716n 1 0 8
970717n 0 0 8
970828n 0 0 8
970830n 0 0 8
970903n 0 0 8
970904n 0 0 8
971205n 0 0 8
980114n 0 0 8
980125n 1 1 9
980601n 0 0 9
980919n 0 0 9
981028n 0 0 9
990926n 0 0 9

The cumulative OR mask for the J array derived from the calibration scans for the 67 nights in Table 1 is given here in three formats:

John Fowler's format (band, X, Y)
A table listing (Number, X, Y, Number_of_Nights)
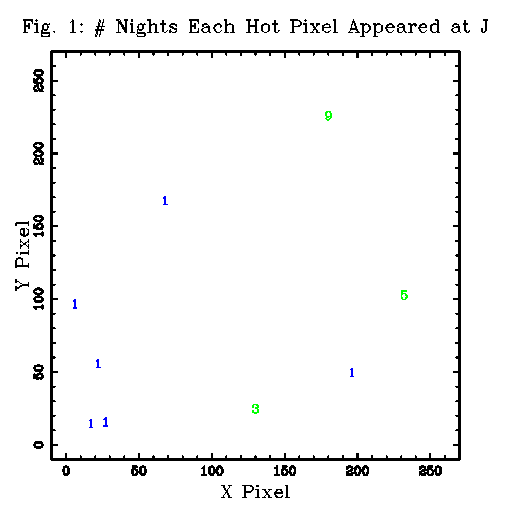
A plot of the number of nights (out of 67 processed to date) that each hot pixel appeared:
NOTE: Pixels appearing more than 10 nights are plotted in red.
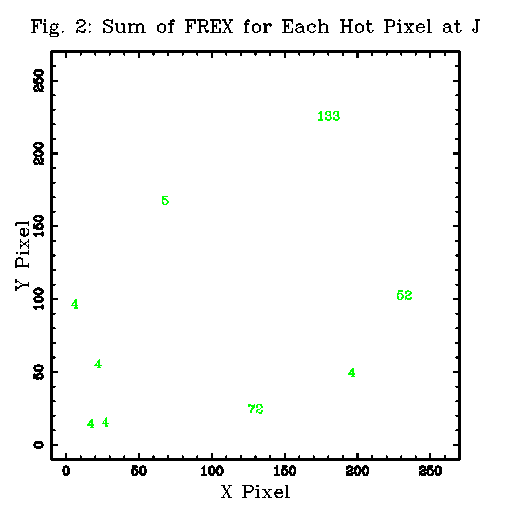
A table listing (Number, X, Y, Sum_of_FREX)
A plot of the sum of FREX for each hot pixel over the 67 nights processed to date:
Analysis

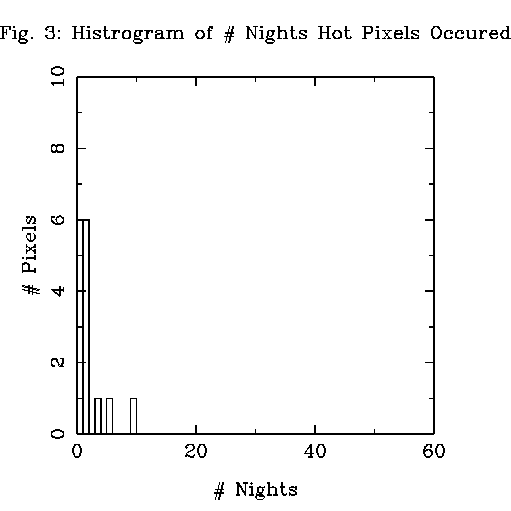
In Figure 3 we plot the distribution of the number of nights each hot pixel appeared. This is a histogram of the night counts plotted in Figure 1.
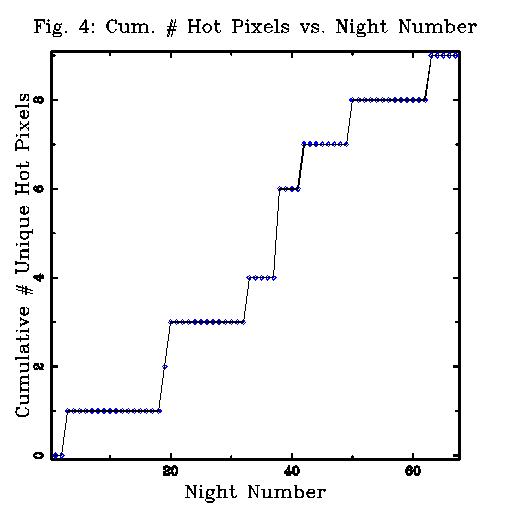
In Figure 4 we plot the cumulaitive number of hot pixels as a function of the running night number.

Last update: 4-Oct-99 (14:0:37), Joe Mazzarella (mazz@ipac.caltech.edu )